Question 21
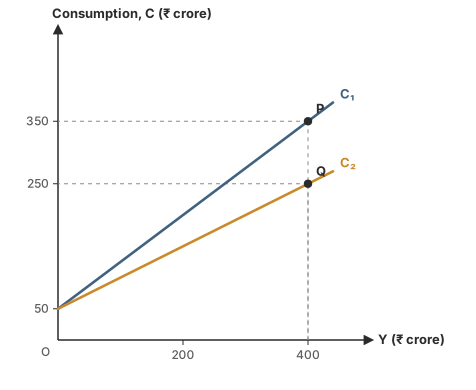
HardOriginal questionThe graph shows two consumption functions with the same autonomous consumption. Which has the higher MPC, and what is it?
Show the answer and explanation
CorrectNot quiteAnswer A
Correct answer: A
Explanation
Both start at ₹50 crore. At Y = ₹400 crore, C₁ = 350 and C₂ = 250.
MPC of C₁ = (350 − 50) ÷ 400 = 0.75; MPC of C₂ = (250 − 50) ÷ 400 = 0.5. C₁ is steeper.
Worth noting
0.875 is C₁'s APC at P (350 ÷ 400), not its MPC.
- Concept
- Slope of the consumption function
- Typical timeTypical
- 100 s
- Your timeYours
- —
Practise this chapter →
Ten questions from Aggregate Demand, Consumption & Saving, at your own pace.