On this page · 9 sections 01 The core idea 02 The consumption function 03 The propensities 04 The saving function 05 Investment 06 Exam shortcuts 07 Common mistakes 08 Quick revision 09 Check your understanding Keynes's question: what decides how much an economy produces in the short run? His answer is aggregate demand (AD), the total planned spending on final goods and services. In a two-sector economy AD = C + I; with the government and trade, AD = C + I + G + (X − M).
This chapter builds the two parts of AD in the simple model: consumption, which depends on income, and investment, which does not.
c ˉ \bar{c} c ˉ autonomous consumption : spending at zero income, paid for from past savings or borrowing.b is the marginal propensity to consume (MPC), the slope of the line.
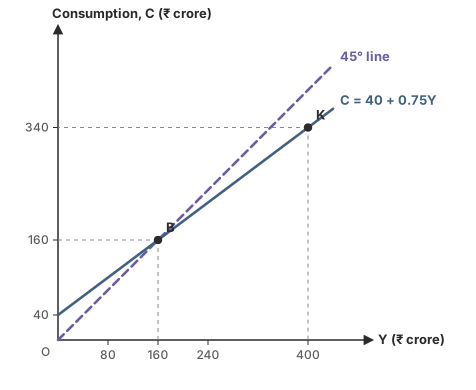
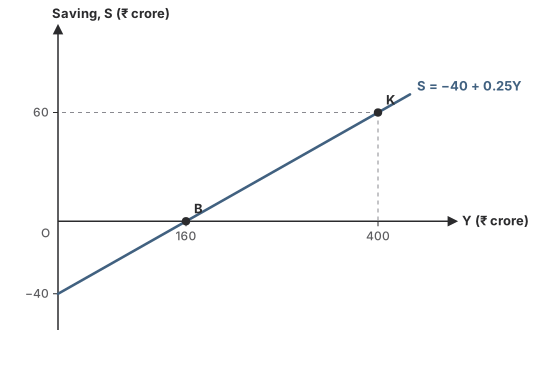
Above the 45° line people consume more than their income; at B (₹160 crore) they consume all of it; beyond B they save. The 45° line marks every point where the vertical value equals the horizontal one. Where C meets it, consumption equals income and saving is zero: the break-even point , at Y = c ˉ ÷ ( 1 − b ) Y = \bar{c} \div (1 - b) Y = c ˉ ÷ ( 1 − b )
Example 1 · From a schedule
Income 0, 100, 200, 300, 400 (₹ crore); consumption 40, 115, 190, 265, 340.
Each ₹100 crore of income raises consumption by ₹75 crore: MPC = 0.75, MPS = 0.25.
At Y = 100, APC = 115 ÷ 100 = 1.15: below break-even, people dissave.
At Y = 400, saving = 60, so APS = 60 ÷ 400 = 0.15, below the MPS.
Answer MPC 0.75; APC falls as income rises
Ratio Can it exceed 1? Can it be negative? APC Yes, below break-even No APS No Yes, below break-even MPC, MPS No (between 0 and 1) No
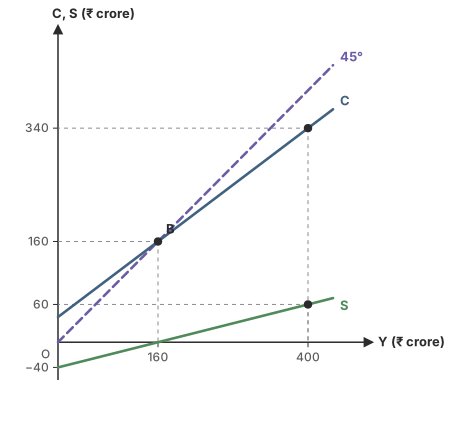
Saving is the vertical gap between the 45° line and C; it is zero at the same income, B, on both graphs. S starts at − c ˉ -\bar{c} − c ˉ
At low incomes the level of saving is negative, but the MPS is still a positive fraction.
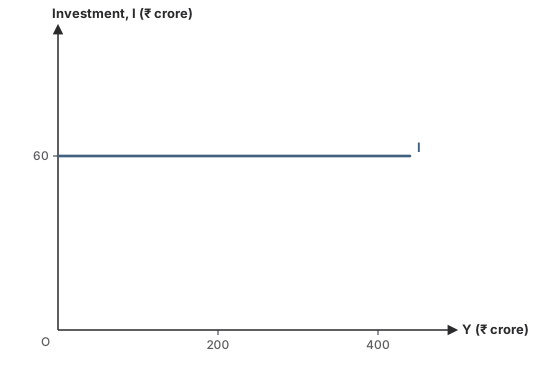
In the simple model, planned investment is autonomous : the same at every income, a horizontal line. Ex ante means planned; ex post means actual.
If planned saving is ₹120 crore and planned investment ₹100 crore, households spend ₹20 crore less than firms expected, so ₹20 crore of unsold goods pile up. That is unplanned inventory investment, and actual investment becomes 120: ex post saving always equals ex post investment . Ex ante, they match only at equilibrium.
Break-even income = c ˉ ÷ \bar{c} \div c ˉ ÷
MPC = 1 − MPS; APC = 1 − APS.
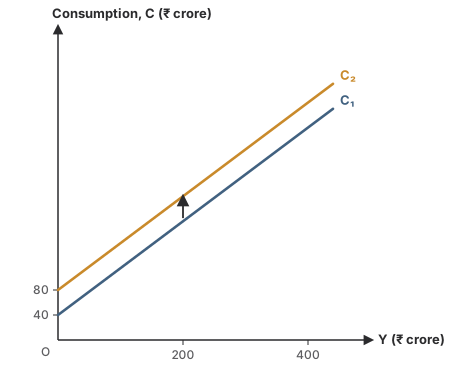
A parallel shift of C is a change in c ˉ \bar{c} c ˉ
AD is planned spending; C + S is income.
Using C ÷ Y when the MPC is asked.
Saying MPS can be negative.
Taking the break-even point as equilibrium.
Writing AD = C + S.
Consumption
C = c̄ + bY; b = MPC
Break-even: C = Y, S = 0
APC > 1 below break-even
Saving
S = −c̄ + (1 − b)Y
MPC + MPS = 1; APC + APS = 1
Investment
Autonomous in the simple model
Ex post S = I always; ex ante only at equilibrium
Putting C and I together to find equilibrium income is in income determination and the multiplier .
Next · 08 Quick revision → Check your understanding 60 questions, grouped by type, easy to hard. Pick an answer and check it. The worked solution opens when you ask for it.
Components of aggregate demand Q1 of 60 Q1
Components of aggregate demand 8 questions Options for question 1 A Option A the total output produced in an economy B Option B the total planned spending on final goods and services in an economy C Option C the demand for one good by all buyers D Option D the money supply
Skip Check Show the explanation Hide the explanation Next question Try again
Show the explanation Hide the explanation Answer B · the total planned spending on final goods and services in an economy
AD is ex ante (planned) spending by all sectors at a given level of income.
In a two-sector economy, aggregate demand is
Options for question 2 A Option A C + I + G B Option B C + S C Option C C + I + G + (X − M) D Option D C + I
Skip Check Show the explanation Hide the explanation Next question Try again
Show the explanation Hide the explanation Answer D · C + I
With only households and firms, planned spending is consumption plus investment.
Worth noting
C + S is income, the use of income by households, not spending.
Match each component of aggregate demand with an example.
List I List II A. Consumption (C) I. The government builds a highway B. Investment (I) II. A family buys clothes C. Government spending (G) III. Foreigners buy Indian tea, minus India's purchases from abroad D. Net exports (X − M) IV. A firm buys new machines
Options for question 3 A Option A A-II, B-IV, C-I, D-III B Option B A-II, B-I, C-III, D-IV C Option C A-I, B-II, C-IV, D-III D Option D A-IV, B-III, C-II, D-I
Skip Check Show the explanation Hide the explanation Next question Try again
Show the explanation Hide the explanation Answer A · A-II, B-IV, C-I, D-III
Each sector's spending is one component of AD.
In an economy, C = ₹600 crore, I = ₹200 crore, G = ₹150 crore, X = ₹80 crore and M = ₹100 crore. Aggregate demand is
Options for question 4 A Option A ₹800 crore B Option B ₹930 crore C Option C ₹950 crore D Option D ₹1,130 crore
Skip Check Show the explanation Hide the explanation Next question Try again
Show the explanation Hide the explanation Answer B · ₹930 crore
AD = 600 + 200 + 150 + (80 − 100) = 950 − 20 = ₹930 crore.
Aggregate supply in Keynes's short-run model equals
Options for question 5 A Option A consumption only B Option B investment only C Option C the value of output D Option D money supply
Skip Check Show the explanation Hide the explanation Next question Try again
Show the explanation Hide the explanation Answer C · the value of output
Output produced is paid out as income, so AS = Y = C + S.
Read the two statements and choose the correct option.
I. Aggregate demand is planned spending at each level of income.
II. In the simple Keynesian model, aggregate supply is shown by the 45° line.
Options for question 6 A Option A Only I B Option B Only II C Option C Both I and II D Option D Neither I nor II
Skip Check Show the explanation Hide the explanation Next question Try again
Show the explanation Hide the explanation Answer C · Both I and II
AD is a schedule of planned spending. I is true.
Along the 45° line, spending equals income, so it shows every point where output and income match. II is true.
Consumption is ₹700 crore and planned investment is ₹150 crore in a two-sector economy. Aggregate demand is
Options for question 7 A Option A ₹550 crore B Option B ₹700 crore C Option C ₹850 crore D Option D ₹1,050 crore
Skip Check Show the explanation Hide the explanation Next question Try again
Show the explanation Hide the explanation Answer C · ₹850 crore
AD = C + I = 700 + 150 = ₹850 crore.
Read the two statements and choose the correct option.
I. Aggregate demand is the spending actually recorded at the end of the year.
II. In a two-sector economy, aggregate demand is C + S.
Options for question 8 A Option A Only I B Option B Only II C Option C Both I and II D Option D Neither I nor II
Skip Check Show the explanation Hide the explanation Next question Try again
Show the explanation Hide the explanation Answer D · Neither I nor II
AD is planned (ex ante) spending, not the recorded figure. I is false.
C + S is income; AD is C + I. II is false.
The consumption function 13 questions The consumption function shows the relation between
Options for question 9 A Option A consumption and the price of one good B Option B consumption and income C Option C investment and the interest rate D Option D saving and the money supply
Skip Check Show the explanation Hide the explanation Next question Try again
Show the explanation Hide the explanation Answer B · consumption and income
Keynes held that households' consumption depends mainly on their income.
In the consumption function C = c̄ + bY, c̄ is
Options for question 10 A Option A the marginal propensity to consume B Option B total saving C Option C autonomous consumption: consumption when income is zero D Option D investment
Skip Check Show the explanation Hide the explanation Next question Try again
Show the explanation Hide the explanation Answer C · autonomous consumption: consumption when income is zero
Even at zero income people must eat, financing it from past savings or borrowing.
b is the MPC, the slope of the consumption line.
The graph shows a consumption function and the 45° line. What is autonomous consumption?
Options for question 11 A Option A ₹40 crore B Option B ₹160 crore C Option C ₹340 crore D Option D ₹0
Skip Check Show the explanation Hide the explanation Next question Try again
Show the explanation Hide the explanation Answer A · ₹40 crore
Autonomous consumption is where the C line meets the vertical axis, at zero income.
The graph shows ₹40 crore.
The graph shows a consumption function and the 45° line. At point B,
Options for question 12 A Option A saving is at its maximum B Option B consumption is zero C Option C income is zero D Option D saving is zero
Skip Check Show the explanation Hide the explanation Next question Try again
Show the explanation Hide the explanation Answer D · saving is zero
B lies on the 45° line, where the value on the vertical axis equals the value on the horizontal axis: C = Y = ₹160 crore.
With all income consumed, saving is zero: B is the break-even point.
The graph shows a consumption function. At point K, how much is saved?
Options for question 13 A Option A ₹−60 crore B Option B ₹60 crore C Option C ₹340 crore D Option D ₹400 crore
Skip Check Show the explanation Hide the explanation Next question Try again
Show the explanation Hide the explanation Answer B · ₹60 crore
At K, income is ₹400 crore and consumption ₹340 crore.
Saving = Y − C = 400 − 340 = ₹60 crore.
The consumption function is C = 50 + 0.8Y. When income is ₹500 crore, consumption is
Options for question 14 A Option A ₹50 crore B Option B ₹400 crore C Option C ₹450 crore D Option D ₹550 crore
Skip Check Show the explanation Hide the explanation Next question Try again
Show the explanation Hide the explanation Answer C · ₹450 crore
C = 50 + 0.8 × 500 = 50 + 400 = ₹450 crore.
The graph shows two consumption functions, C₁ and C₂. The move from C₁ to C₂ is caused by
Options for question 15 A Option A a rise in the MPC B Option B a rise in income C Option C a rise in autonomous consumption with the MPC unchanged D Option D a fall in autonomous consumption
Skip Check Show the explanation Hide the explanation Next question Try again
Show the explanation Hide the explanation Answer C · a rise in autonomous consumption with the MPC unchanged
The lines are parallel, so the slope (MPC) is the same.
C₂ starts higher, at ₹80 crore instead of ₹40 crore: autonomous consumption has risen.
Worth noting
A rise in income is a movement along one line, not a shift to another.
Assertion (A): Consumption is positive even when income is zero.
Reason (R): People need a minimum level of consumption to survive, and pay for it from past savings or borrowing.
Options for question 16 A Option A Both A and R are true, and R is the correct explanation of A. B Option B Both A and R are true, but R is not the correct explanation of A. C Option C A is true, but R is false. D Option D A is false, but R is true.
Skip Check Show the explanation Hide the explanation Next question Try again
Show the explanation Hide the explanation Answer A · Both A and R are true, and R is the correct explanation of A.
This is autonomous consumption, c̄. R explains A.
Read the two statements and choose the correct option.
I. In Keynes's theory, the MPC lies between 0 and 1.
II. When income rises, consumption rises by the full amount of the rise.
Options for question 17 A Option A Only I B Option B Only II C Option C Both I and II D Option D Neither I nor II
Skip Check Show the explanation Hide the explanation Next question Try again
Show the explanation Hide the explanation Answer A · Only I
People consume part of an extra rupee and save the rest, so 0 < MPC < 1. I is true.
Consumption rises by less than income. II is false.
Read the two statements and choose the correct option.
I. Autonomous consumption rises with income.
II. Induced consumption, bY, rises with income.
Options for question 18 A Option A Only I B Option B Only II C Option C Both I and II D Option D Neither I nor II
Skip Check Show the explanation Hide the explanation Next question Try again
Show the explanation Hide the explanation Answer B · Only II
Autonomous consumption, c̄, is the part that does not depend on income. I is false.
Induced consumption is MPC × income. II is true.
The consumption function is C = 100 + 0.7Y. At an income of ₹1,000 crore, the APC is
Options for question 19 A Option A 0.1 B Option B 0.7 C Option C 0.8 D Option D 1.25
Skip Check Show the explanation Hide the explanation Next question Try again
Show the explanation Hide the explanation Answer C · 0.8
C = 100 + 0.7 × 1,000 = 800.
APC = 800 ÷ 1,000 = 0.8, higher than the MPC of 0.7 because of autonomous consumption.
The consumption function is C = 50 + 0.8Y. At what income is saving zero?
Options for question 20 A Option A ₹50 crore B Option B ₹62.5 crore C Option C ₹250 crore D Option D ₹400 crore
Skip Check Show the explanation Hide the explanation Next question Try again
Show the explanation Hide the explanation Answer C · ₹250 crore
Saving is zero where C = Y: Y = 50 + 0.8Y.
0.2Y = 50, so Y = ₹250 crore.
Worth noting
₹62.5 crore divides 50 by 0.8 instead of by 0.2, the MPS.
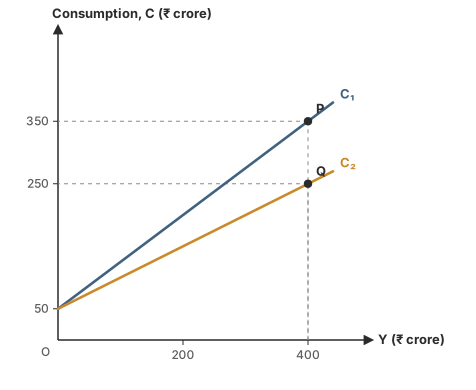
The graph shows two consumption functions with the same autonomous consumption. Which has the higher MPC, and what is it?
Options for question 21 A Option A C₁, with MPC 0.75 B Option B C₂, with MPC 0.5 C Option C C₁, with MPC 0.875 D Option D Both have MPC 0.75
Skip Check Show the explanation Hide the explanation Next question Try again
Show the explanation Hide the explanation Answer A · C₁, with MPC 0.75
Both start at ₹50 crore. At Y = ₹400 crore, C₁ = 350 and C₂ = 250.
MPC of C₁ = (350 − 50) ÷ 400 = 0.75; MPC of C₂ = (250 − 50) ÷ 400 = 0.5. C₁ is steeper.
Worth noting
0.875 is C₁'s APC at P (350 ÷ 400), not its MPC.
APC, MPC, APS and MPS 18 questions The marginal propensity to consume (MPC) is
Options for question 22 A Option A C ÷ Y B Option B ΔC ÷ ΔY C Option C ΔS ÷ ΔY D Option D S ÷ Y
Skip Check Show the explanation Hide the explanation Next question Try again
Show the explanation Hide the explanation Answer B · ΔC ÷ ΔY
MPC is the share of an extra rupee of income that is consumed.
Worth noting
C ÷ Y is the average propensity, APC.
Income rises from ₹1,000 crore to ₹1,200 crore and consumption rises from ₹800 crore to ₹950 crore. The MPC is
Options for question 23 A Option A 0.75 B Option B 0.79 C Option C 0.8 D Option D 1.33
Skip Check Show the explanation Hide the explanation Next question Try again
Show the explanation Hide the explanation Answer A · 0.75
ΔC = 950 − 800 = 150; ΔY = 1,200 − 1,000 = 200.
MPC = 150 ÷ 200 = 0.75.
Worth noting
0.8 is the APC at the start (800 ÷ 1,000), not the MPC.
If the MPC is 0.8, the MPS is
Options for question 24 A Option A 0.2 B Option B 0.8 C Option C 1.25 D Option D 1.8
Skip Check Show the explanation Hide the explanation Next question Try again
Show the explanation Hide the explanation Answer A · 0.2
Each extra rupee is either consumed or saved, so MPC + MPS = 1.
MPS = 1 − 0.8 = 0.2.
Income is ₹1,000 crore and consumption is ₹900 crore. The APS is
Options for question 25 A Option A 0.1 B Option B 0.9 C Option C 1.11 D Option D 100
Skip Check Show the explanation Hide the explanation Next question Try again
Show the explanation Hide the explanation Answer A · 0.1
Saving = 1,000 − 900 = 100.
APS = S ÷ Y = 100 ÷ 1,000 = 0.1.
An economy's consumption schedule:
Income (₹ crore) 0 100 200 300 400 Consumption (₹ crore) 40 115 190 265 340
Options for question 26 A Option A 0.25 B Option B 0.75 C Option C 0.85 D Option D 1.15
Skip Check Show the explanation Hide the explanation Next question Try again
Show the explanation Hide the explanation Answer B · 0.75
Each ₹100 crore rise in income raises consumption by ₹75 crore (40 → 115 → 190 …).
MPC = 75 ÷ 100 = 0.75.
An economy's consumption schedule:
Income (₹ crore) 0 100 200 300 400 Consumption (₹ crore) 40 115 190 265 340
What is the APC when income is ₹100 crore?
Options for question 27 A Option A 0.15 B Option B 0.75 C Option C 0.87 D Option D 1.15
Skip Check Show the explanation Hide the explanation Next question Try again
Show the explanation Hide the explanation Answer D · 1.15
APC = C ÷ Y = 115 ÷ 100 = 1.15.
APC is above 1 because income is below the break-even level: people are dissaving.
Which of these can be greater than 1?
Options for question 28 A Option A MPC B Option B MPS C Option C APS D Option D APC
Skip Check Show the explanation Hide the explanation Next question Try again
Show the explanation Hide the explanation Answer D · APC
Below the break-even income, consumption exceeds income, so APC > 1.
In Keynes's theory MPC and MPS lie between 0 and 1, and APS is at most 1.
Which of these can be negative?
Options for question 29 A Option A APS B Option B APC C Option C MPC D Option D MPS
Skip Check Show the explanation Hide the explanation Next question Try again
Show the explanation Hide the explanation Answer A · APS
At incomes below break-even, saving is negative, so APS = S ÷ Y is negative.
MPC and MPS are positive fractions in Keynes's theory; APC is always positive.
Read the two statements and choose the correct option.
I. MPC + MPS = 1.
II. APC + APS = 1.
Options for question 30 A Option A Only I B Option B Only II C Option C Both I and II D Option D Neither I nor II
Skip Check Show the explanation Hide the explanation Next question Try again
Show the explanation Hide the explanation Answer C · Both I and II
Extra income is consumed or saved, so MPC + MPS = 1. I is true.
Total income is consumed or saved, so C ÷ Y + S ÷ Y = 1. II is true.
The MPS is 0.3 and income rises by ₹500 crore. Consumption rises by
Options for question 31 A Option A ₹150 crore B Option B ₹350 crore C Option C ₹500 crore D Option D ₹1,667 crore
Skip Check Show the explanation Hide the explanation Next question Try again
Show the explanation Hide the explanation Answer B · ₹350 crore
MPC = 1 − 0.3 = 0.7.
ΔC = 0.7 × 500 = ₹350 crore.
Worth noting
₹150 crore is the rise in saving.
Match each ratio with its formula.
List I List II A. APC I. ΔC ÷ ΔY B. MPC II. ΔS ÷ ΔY C. APS III. C ÷ Y D. MPS IV. S ÷ Y
Options for question 32 A Option A A-III, B-IV, C-II, D-I B Option B A-IV, B-III, C-I, D-II C Option C A-II, B-I, C-IV, D-III D Option D A-III, B-I, C-IV, D-II
Skip Check Show the explanation Hide the explanation Next question Try again
Show the explanation Hide the explanation Answer D · A-III, B-I, C-IV, D-II
Average = total ÷ income; marginal = change ÷ change in income.
At the break-even level of income, the APC is
Options for question 33 A Option A 0 B Option B 1 C Option C greater than 1 D Option D equal to the MPC
Skip Check Show the explanation Hide the explanation Next question Try again
Show the explanation Hide the explanation Answer B · 1
At break-even, C = Y, so APC = C ÷ Y = 1 and APS = 0.
Income rises by ₹400 crore and saving rises by ₹100 crore. The MPC is
Options for question 34 A Option A 0.25 B Option B 0.75 C Option C 0.8 D Option D 4
Skip Check Show the explanation Hide the explanation Next question Try again
Show the explanation Hide the explanation Answer B · 0.75
MPS = 100 ÷ 400 = 0.25.
MPC = 1 − 0.25 = 0.75.
The APC is 0.8 and income is ₹2,000 crore. Saving is
Options for question 35 A Option A ₹200 crore B Option B ₹400 crore C Option C ₹1,600 crore D Option D ₹2,500 crore
Skip Check Show the explanation Hide the explanation Next question Try again
Show the explanation Hide the explanation Answer B · ₹400 crore
APS = 1 − 0.8 = 0.2.
S = 0.2 × 2,000 = ₹400 crore.
Income rises from ₹500 crore to ₹650 crore and consumption rises from ₹400 crore to ₹520 crore. The MPC is
Options for question 36 A Option A 0.2 B Option B 0.75 C Option C 0.8 D Option D 1.25
Skip Check Show the explanation Hide the explanation Next question Try again
Show the explanation Hide the explanation Answer C · 0.8
ΔC = 520 − 400 = 120; ΔY = 650 − 500 = 150.
MPC = 120 ÷ 150 = 0.8.
An economy's consumption schedule:
Income (₹ crore) 0 100 200 300 400 Consumption (₹ crore) 40 115 190 265 340
What is the APS when income is ₹400 crore?
Options for question 37 A Option A 0.15 B Option B 0.25 C Option C 0.6 D Option D 0.85
Skip Check Show the explanation Hide the explanation Next question Try again
Show the explanation Hide the explanation Answer A · 0.15
Saving at Y = 400: 400 − 340 = 60.
APS = 60 ÷ 400 = 0.15.
Worth noting
0.25 is the MPS. APS and MPS differ because of autonomous consumption.
Assertion (A): With a consumption function C = c̄ + bY and c̄ > 0, the APC falls as income rises.
Reason (R): APC = c̄ ÷ Y + b, and c̄ ÷ Y gets smaller as Y grows.
Options for question 38 A Option A Both A and R are true, and R is the correct explanation of A. B Option B Both A and R are true, but R is not the correct explanation of A. C Option C A is true, but R is false. D Option D A is false, but R is true.
Skip Check Show the explanation Hide the explanation Next question Try again
Show the explanation Hide the explanation Answer A · Both A and R are true, and R is the correct explanation of A.
Dividing C by Y gives APC = c̄ ÷ Y + b, which approaches b from above.
R explains A.
At an income of ₹1,000 crore, the APC is 0.9. Income rises to ₹1,200 crore and consumption rises by ₹160 crore. The new APC is
Options for question 39 A Option A 0.8 B Option B 0.88 C Option C 0.9 D Option D 1.06
Skip Check Show the explanation Hide the explanation Next question Try again
Show the explanation Hide the explanation Answer B · 0.88
Old C = 0.9 × 1,000 = 900; new C = 900 + 160 = 1,060.
New APC = 1,060 ÷ 1,200 ≈ 0.88. (The MPC is 160 ÷ 200 = 0.8.)
Worth noting
0.8 is the MPC over the change, not the new APC.
The saving function and break-even 13 questions If C = c̄ + bY, the saving function is
Options for question 40 A Option A S = c̄ + (1 − b)Y B Option B S = −c̄ + bY C Option C S = −c̄ + (1 − b)Y D Option D S = c̄ − bY
Skip Check Show the explanation Hide the explanation Next question Try again
Show the explanation Hide the explanation Answer C · S = −c̄ + (1 − b)Y
S = Y − C = Y − c̄ − bY = −c̄ + (1 − b)Y.
The consumption function is C = 50 + 0.8Y. The saving function is
Options for question 41 A Option A S = 50 + 0.2Y B Option B S = −50 + 0.8Y C Option C S = −50 + 0.2Y D Option D S = 50 − 0.8Y
Skip Check Show the explanation Hide the explanation Next question Try again
Show the explanation Hide the explanation Answer C · S = −50 + 0.2Y
S = Y − C = Y − 50 − 0.8Y = −50 + 0.2Y.
The graph shows a saving function. What is saving when income is zero?
Options for question 42 A Option A ₹0 B Option B ₹−40 crore C Option C ₹40 crore D Option D ₹60 crore
Skip Check Show the explanation Hide the explanation Next question Try again
Show the explanation Hide the explanation Answer B · ₹−40 crore
The saving line starts at −₹40 crore on the vertical axis.
At zero income, households dissave to pay for autonomous consumption of ₹40 crore.
The graph shows a saving function. What is the MPS?
Options for question 43 A Option A 0.15 B Option B 0.25 C Option C 0.4 D Option D 0.75
Skip Check Show the explanation Hide the explanation Next question Try again
Show the explanation Hide the explanation Answer B · 0.25
From B to K, income rises 160 → 400 (by 240) and saving rises 0 → 60 (by 60).
MPS = 60 ÷ 240 = 0.25.
Worth noting
0.15 is the APS at K (60 ÷ 400).
The graph shows a saving function. Below an income of ₹160 crore, households
Options for question 44 A Option A save part of their income B Option B neither save nor consume C Option C save all their income D Option D dissave: they consume more than their income
Skip Check Show the explanation Hide the explanation Next question Try again
Show the explanation Hide the explanation Answer D · dissave: they consume more than their income
The saving line is below the income axis to the left of B, so S is negative there.
The graph shows the consumption line, the saving line and the 45° line. Which statement is true at an income of ₹160 crore?
Options for question 45 A Option A C meets the 45° line and S crosses the income axis B Option B C is at its highest and S at its lowest C Option C C and S are equal D Option D C is zero and S equals income
Skip Check Show the explanation Hide the explanation Next question Try again
Show the explanation Hide the explanation Answer A · C meets the 45° line and S crosses the income axis
At B, C = Y = 160, so S = Y − C = 0.
The break-even income is the same point on both graphs.
Assertion (A): The saving function starts below the income axis.
Reason (R): At zero income, saving equals minus autonomous consumption.
Options for question 46 A Option A Both A and R are true, and R is the correct explanation of A. B Option B Both A and R are true, but R is not the correct explanation of A. C Option C A is true, but R is false. D Option D A is false, but R is true.
Skip Check Show the explanation Hide the explanation Next question Try again
Show the explanation Hide the explanation Answer A · Both A and R are true, and R is the correct explanation of A.
S = −c̄ + (1 − b)Y, which is −c̄ when Y = 0. R explains A.
The saving function is S = −30 + 0.25Y. At an income of ₹200 crore, saving is
Options for question 47 A Option A ₹−30 crore B Option B ₹20 crore C Option C ₹50 crore D Option D ₹80 crore
Skip Check Show the explanation Hide the explanation Next question Try again
Show the explanation Hide the explanation Answer B · ₹20 crore
S = −30 + 0.25 × 200 = −30 + 50 = ₹20 crore.
Assertion (A): Saving can be negative at low levels of income.
Reason (R): The MPS is negative at low levels of income.
Options for question 48 A Option A Both A and R are true, and R is the correct explanation of A. B Option B Both A and R are true, but R is not the correct explanation of A. C Option C A is true, but R is false. D Option D A is false, but R is true.
Skip Check Show the explanation Hide the explanation Next question Try again
Show the explanation Hide the explanation Answer C · A is true, but R is false.
A is true: below break-even, consumption exceeds income.
R is false: the MPS is a positive fraction at every income; it is the level of saving that is negative.
The saving function is S = −50 + 0.4Y. At an income of ₹100 crore, saving is
Options for question 49 A Option A ₹−50 crore B Option B ₹−10 crore C Option C ₹10 crore D Option D ₹40 crore
Skip Check Show the explanation Hide the explanation Next question Try again
Show the explanation Hide the explanation Answer B · ₹−10 crore
S = −50 + 0.4 × 100 = −50 + 40 = ₹−10 crore: households dissave.
The graph shows C and S. The vertical gap between the 45° line and the C line at an income of ₹400 crore equals
Options for question 50 A Option A consumption, ₹340 crore B Option B autonomous consumption, ₹40 crore C Option C income, ₹400 crore D Option D saving at that income, ₹60 crore
Skip Check Show the explanation Hide the explanation Next question Try again
Show the explanation Hide the explanation Answer D · saving at that income, ₹60 crore
The 45° line is at Y = 400; C is at 340.
The gap 400 − 340 = 60 is the income not consumed: saving, which is the S line's height there.
Read the two statements and choose the correct option.
I. The slope of the saving function is the MPS.
II. The slope of the consumption function and the slope of the saving function add up to 1.
Options for question 51 A Option A Only I B Option B Only II C Option C Both I and II D Option D Neither I nor II
Skip Check Show the explanation Hide the explanation Next question Try again
Show the explanation Hide the explanation Answer C · Both I and II
S rises by MPS for each rupee of income. I is true.
The slopes are MPC and MPS, which add to 1. II is true.
The saving function is S = −60 + 0.3Y. The break-even level of income is
Options for question 52 A Option A ₹18 crore B Option B ₹60 crore C Option C ₹86 crore D Option D ₹200 crore
Skip Check Show the explanation Hide the explanation Next question Try again
Show the explanation Hide the explanation Answer D · ₹200 crore
Break-even is where S = 0: 0.3Y = 60.
Y = 60 ÷ 0.3 = ₹200 crore.
Planned investment; ex ante and ex post 8 questions In the simple Keynesian model, investment is taken as autonomous, which means
Options for question 53 A Option A it does not depend on the level of income B Option B it rises with income C Option C it is decided by the government D Option D it is always zero
Skip Check Show the explanation Hide the explanation Next question Try again
Show the explanation Hide the explanation Answer A · it does not depend on the level of income
Planned investment is fixed at Ī whatever the level of income, so its line is horizontal.
The graph shows an investment function. What does it tell us?
Options for question 54 A Option A Investment rises as income rises B Option B Investment is zero at low incomes C Option C Planned investment is ₹60 crore at every level of income D Option D Investment falls as income rises
Skip Check Show the explanation Hide the explanation Next question Try again
Show the explanation Hide the explanation Answer C · Planned investment is ₹60 crore at every level of income
A horizontal line means the value does not change with income: autonomous investment of ₹60 crore.
Options for question 55 A Option A actual investment at the end of the year B Option B planned or intended investment C Option C investment by the government D Option D investment abroad
Skip Check Show the explanation Hide the explanation Next question Try again
Show the explanation Hide the explanation Answer B · planned or intended investment
Ex ante = planned; ex post = actual, which includes unplanned changes in inventory.
Read the two statements and choose the correct option.
I. Ex ante saving and ex ante investment are always equal.
II. Ex ante saving equals ex ante investment only at equilibrium income.
Options for question 56 A Option A Only I B Option B Only II C Option C Both I and II D Option D Neither I nor II
Skip Check Show the explanation Hide the explanation Next question Try again
Show the explanation Hide the explanation Answer B · Only II
Savers and investors are different people with different plans, so I is false.
Income adjusts until the plans match; that is equilibrium. II is true.
Which of these is investment in the macroeconomic model?
Options for question 57 A Option A A firm adds a new floor to its factory B Option B A family buys shares C Option C A student deposits money in a bank D Option D A family buys a second-hand car
Skip Check Show the explanation Hide the explanation Next question Try again
Show the explanation Hide the explanation Answer A · A firm adds a new floor to its factory
Investment is spending on new capital goods and additions to inventories.
Which of these is unplanned investment?
Options for question 58 A Option A A firm building a new factory as planned B Option B A firm buying machines it ordered last year C Option C A planned rise in stocks before a festival D Option D Unsold goods piling up because sales were lower than firms expected
Skip Check Show the explanation Hide the explanation Next question Try again
Show the explanation Hide the explanation Answer D · Unsold goods piling up because sales were lower than firms expected
Unsold stock that firms did not intend to hold is unplanned inventory investment.
Planned saving is ₹120 crore and planned investment is ₹100 crore. What happens to firms' inventories?
Options for question 59 A Option A They fall by ₹20 crore more than planned B Option B They rise by ₹20 crore more than planned C Option C They do not change D Option D They rise by ₹120 crore
Skip Check Show the explanation Hide the explanation Next question Try again
Show the explanation Hide the explanation Answer B · They rise by ₹20 crore more than planned
Households spend ₹20 crore less than firms expected, so ₹20 crore of output is unsold.
Unsold goods are unplanned inventory investment, so actual investment = 100 + 20 = 120 = saving.
Assertion (A): Ex post saving always equals ex post investment.
Reason (R): Any gap between planned saving and planned investment shows up as an unplanned change in inventories, which is counted in actual investment.
Options for question 60 A Option A Both A and R are true, and R is the correct explanation of A. B Option B Both A and R are true, but R is not the correct explanation of A. C Option C A is true, but R is false. D Option D A is false, but R is true.
Skip Check Show the explanation Hide the explanation Back to start Try again
Show the explanation Hide the explanation Answer A · Both A and R are true, and R is the correct explanation of A.
Actual (ex post) values are an accounting identity; planned (ex ante) values need not match.
R explains A.
Question types · easy to hard
NTA's Economics syllabus is three courses: Introductory Microeconomics, Introductory Macroeconomics and Indian Economic Development, each split into units with a list of topics. It prints no chapters and no split of the 50 questions across the courses. So the areas here are NTA's three courses, and the chapters inside them are ours: a unit that covers several ideas, such as consumer behaviour and demand, is split into a chapter for each, so that a chapter can be practised in one sitting. All three courses are here.