Question 43
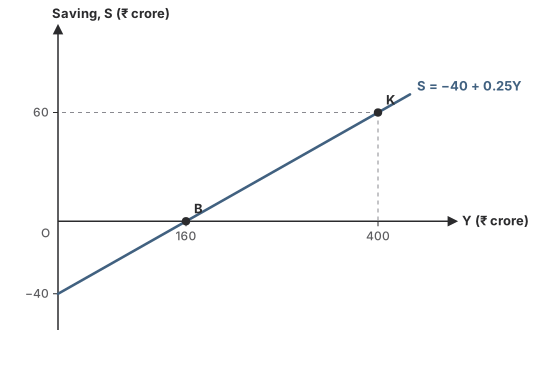
MediumOriginal questionThe graph shows a saving function. What is the MPS?
Show the answer and explanation
CorrectNot quiteAnswer B
Correct answer: B
Explanation
From B to K, income rises 160 → 400 (by 240) and saving rises 0 → 60 (by 60).
MPS = 60 ÷ 240 = 0.25.
Worth noting
0.15 is the APS at K (60 ÷ 400).
- Concept
- MPS from the saving line
- Typical timeTypical
- 70 s
- Your timeYours
- —
Practise this chapter →
Ten questions from Aggregate Demand, Consumption & Saving, at your own pace.