On this page · 9 sections 01 The core idea 02 Equilibrium where AD meets output 03 Equilibrium where saving meets investment 04 The investment multiplier 05 The paradox of thrift 06 Exam shortcuts 07 Common mistakes 08 Quick revision 09 Check your understanding Firms produce what they expect to sell. If planned spending is more than output, stocks run down and firms produce more; if it is less, unsold stock piles up and they produce less. Output settles where aggregate demand equals output .
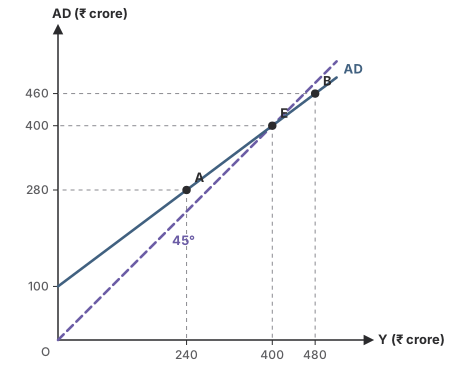
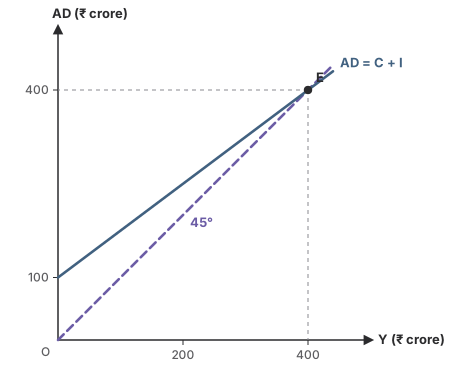
Left of E, AD is above the 45° line and output rises; right of E, it is below and output falls. With C = 40 + 0.75Y and I = 60, AD = 100 + 0.75Y.
At Y = 240, AD = 280: spending is 40 more than output, stocks fall, output rises.
At Y = 480, AD = 460: output is 20 more than spending, stocks pile up, output falls.
At Y = 400, AD = 400: no unplanned change in stocks. This is equilibrium .
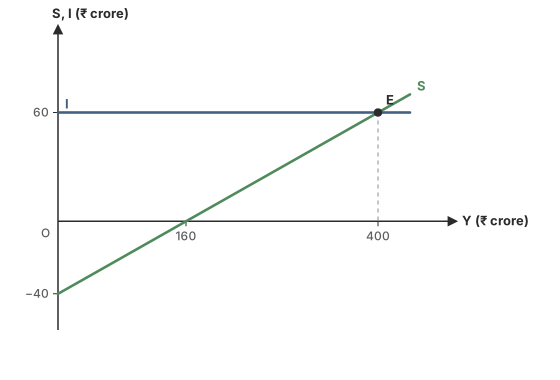
Since Y = C + S and AD = C + I, AD = Y exactly when S = I . The two approaches always give the same answer.
Equilibrium is where planned saving meets planned investment; ₹160 crore is only the break-even point.
Equilibrium need not be full employment. Keynes's point is that AD can settle output below the level that employs everyone willing to work.
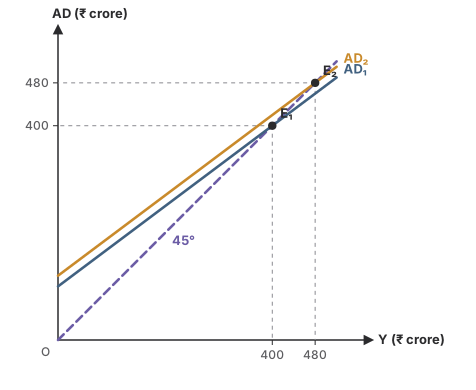
A ₹20 crore rise in investment moves equilibrium from ₹400 crore to ₹480 crore: k = 80 ÷ 20 = 4. Example 1 · Round by round
Investment rises by ₹100 crore and MPC = 0.8.
Round 1: the ₹100 crore becomes income for those who make the capital goods.
Round 2: they spend 0.8 × 100 = 80, which becomes others' income; round 3: 64; and so on.
The rounds add to 100 × 1 ÷ 0.2 = 500. Of this, consumption is 400 and saving 100, the same as the new investment.
The multiplier applies to any autonomous spending (consumption, investment, government spending) and works in reverse too. It lies between 1 (MPC = 0) and infinity (MPC = 1).
If everyone tries to save more, consumption and AD fall, so income falls. At the lower income, saving is back to the unchanged planned investment.
Example 2 · Thriftier households
c̄ = 40, I = 60 fixed. The MPS rises from 0.2 to 0.25.
Before: Y = (40 + 60) ÷ 0.2 = 500; S = −40 + 0.2 × 500 = 60.
After: Y = 100 ÷ 0.25 = 400; S = −40 + 0.25 × 400 = 60.
Answer Income falls by ₹100 crore; total saving does not rise
Y = (c̄ + Ī) ÷ MPS.
k = 1 ÷ MPS; ΔY = k × ΔI; ΔI = ΔY ÷ k.
Total ΔC = ΔY − ΔI; total ΔS = ΔI.
AD > output: stocks fall, output rises.
Dividing by the MPC instead of the MPS.
Giving the new income when the rise is asked, or the reverse.
Taking the break-even point (S = 0) as equilibrium.
Thinking the rounds grow; each is MPC times the last.
Equilibrium
AD = output, or planned S = planned I
Y = (c̄ + Ī) ÷ (1 − MPC)
Can be below full employment
Multiplier
k = 1 ÷ (1 − MPC) = 1 ÷ MPS
Rounds shrink by the MPC each time
Works on any autonomous spending, both ways
Thrift
Everyone saving more lowers income
Saving ends where it started when I is fixed
What happens when equilibrium is above or below full employment is in excess and deficient demand .
Next · 08 Quick revision → Check your understanding 58 questions, grouped by type, easy to hard. Pick an answer and check it. The worked solution opens when you ask for it.
Equilibrium: AD equals output Q1 of 58 Q1
Equilibrium: AD equals output 10 questions In the simple Keynesian model, equilibrium income is where
Options for question 1 A Option A consumption equals investment B Option B aggregate demand equals output (aggregate supply) C Option C saving is zero D Option D income is at its highest
Skip Check Show the explanation Hide the explanation Next question Try again
Show the explanation Hide the explanation Answer B · aggregate demand equals output (aggregate supply)
Firms produce what they expect to sell. When planned spending matches output, there is no reason to change output.
Worth noting
Saving is zero at the break-even income, which is not the equilibrium unless investment is zero.
The graph shows the AD line and the 45° line. At point E, aggregate demand is
Options for question 2 A Option A ₹100 crore B Option B ₹400 crore C Option C ₹500 crore D Option D zero
Skip Check Show the explanation Hide the explanation Next question Try again
Show the explanation Hide the explanation Answer B · ₹400 crore
E lies on both lines, so AD = output = ₹400 crore.
The graph shows the AD line and the 45° line. What is equilibrium income?
Options for question 3 A Option A ₹100 crore B Option B ₹200 crore C Option C ₹400 crore D Option D ₹480 crore
Skip Check Show the explanation Hide the explanation Next question Try again
Show the explanation Hide the explanation Answer C · ₹400 crore
Equilibrium is where AD crosses the 45° line, at E.
E is at an income of ₹400 crore.
Worth noting
₹100 crore is autonomous spending (c̄ + I), where AD starts.
The graph shows the AD line and the 45° line. At an income of ₹240 crore (point A), what happens?
Options for question 4 A Option A Output exceeds AD by ₹40 crore and output falls B Option B The economy is in equilibrium C Option C AD exceeds output by ₹280 crore D Option D AD exceeds output by ₹40 crore, stocks run down and output rises
Skip Check Show the explanation Hide the explanation Next question Try again
Show the explanation Hide the explanation Answer D · AD exceeds output by ₹40 crore, stocks run down and output rises
At Y = 240, AD = 280 (point A lies above the 45° line).
Planned spending exceeds output by 40, so firms sell from stock and raise output towards E.
The graph shows the AD line and the 45° line. At an income of ₹480 crore (point B), what happens?
Options for question 5 A Option A Output exceeds AD by ₹20 crore, unsold stock piles up and output falls B Option B AD exceeds output by ₹20 crore and output rises C Option C The economy is in equilibrium D Option D Output exceeds AD by ₹80 crore
Skip Check Show the explanation Hide the explanation Next question Try again
Show the explanation Hide the explanation Answer A · Output exceeds AD by ₹20 crore, unsold stock piles up and output falls
At Y = 480, AD = 460 (point B lies below the 45° line).
Output is 20 more than planned spending, so unplanned stock builds up and firms cut output towards E.
Worth noting
₹80 crore is the gap between 480 and equilibrium 400, not the gap between output and AD at 480.
Assertion (A): If aggregate demand is greater than output, output will rise.
Reason (R): Firms meet the extra demand from stock, and the fall in their inventories signals them to produce more.
Options for question 6 A Option A Both A and R are true, and R is the correct explanation of A. B Option B Both A and R are true, but R is not the correct explanation of A. C Option C A is true, but R is false. D Option D A is false, but R is true.
Skip Check Show the explanation Hide the explanation Next question Try again
Show the explanation Hide the explanation Answer A · Both A and R are true, and R is the correct explanation of A.
Unplanned fall in inventories → more production. R explains A.
Along the 45° line in the income–expenditure diagram,
Options for question 7 A Option A consumption is zero B Option B saving is always positive C Option C the vertical value equals the horizontal value D Option D investment equals zero
Skip Check Show the explanation Hide the explanation Next question Try again
Show the explanation Hide the explanation Answer C · the vertical value equals the horizontal value
Every point on the 45° line has spending = income, so it marks all possible equilibria.
Read the two statements and choose the correct option.
I. At equilibrium income, there is no unplanned change in inventories.
II. At equilibrium income, there must be full employment.
Options for question 8 A Option A Only I B Option B Only II C Option C Both I and II D Option D Neither I nor II
Skip Check Show the explanation Hide the explanation Next question Try again
Show the explanation Hide the explanation Answer A · Only I
At equilibrium, firms sell exactly what they planned to, so stocks change only as planned. I is true.
Keynes showed that equilibrium can come with unemployment. II is false.
The graph shows the AD line and the 45° line. The value of AD at zero income, ₹100 crore, is
Options for question 9 A Option A equilibrium income B Option B total saving C Option C autonomous consumption plus investment D Option D the MPC
Skip Check Show the explanation Hide the explanation Next question Try again
Show the explanation Hide the explanation Answer C · autonomous consumption plus investment
At Y = 0, AD = c̄ + Ī: spending that does not depend on income.
Assertion (A): When aggregate demand is less than output, firms cut production.
Reason (R): When aggregate demand is less than output, firms' inventories fall below what they planned.
Options for question 10 A Option A Both A and R are true, and R is the correct explanation of A. B Option B Both A and R are true, but R is not the correct explanation of A. C Option C A is true, but R is false. D Option D A is false, but R is true.
Skip Check Show the explanation Hide the explanation Next question Try again
Show the explanation Hide the explanation Answer C · A is true, but R is false.
A is true: unsold goods pile up, so firms produce less.
R is false: inventories rise above what was planned, not fall.
Equilibrium: saving equals investment 7 questions In the saving-investment approach, equilibrium income is where
Options for question 11 A Option A saving is zero B Option B planned saving equals planned investment C Option C investment is at its highest D Option D consumption equals saving
Skip Check Show the explanation Hide the explanation Next question Try again
Show the explanation Hide the explanation Answer B · planned saving equals planned investment
Y = C + S and AD = C + I, so AD = Y exactly when S = I.
The graph shows the saving and investment lines. Equilibrium income is
Options for question 12 A Option A ₹60 crore B Option B ₹160 crore C Option C ₹240 crore D Option D ₹400 crore
Skip Check Show the explanation Hide the explanation Next question Try again
Show the explanation Hide the explanation Answer D · ₹400 crore
Equilibrium is where S meets I, at E.
E is at an income of ₹400 crore.
Worth noting
₹160 crore is the break-even income, where S = 0.
The graph shows the saving and investment lines. At an income of ₹300 crore, planned saving is ₹35 crore. What happens?
Options for question 13 A Option A Planned saving exceeds planned investment, so income falls B Option B The economy is in equilibrium C Option C Planned investment exceeds planned saving by ₹25 crore, so income rises D Option D Investment falls to ₹35 crore
Skip Check Show the explanation Hide the explanation Next question Try again
Show the explanation Hide the explanation Answer C · Planned investment exceeds planned saving by ₹25 crore, so income rises
I = 60 at every income; S = 35 at Y = 300.
I > S by 25: injections exceed leakages, so income rises towards ₹400 crore.
Assertion (A): The AD = AS approach and the S = I approach give the same equilibrium income.
Reason (R): Since Y = C + S and AD = C + I, the condition AD = Y is the same as S = I.
Options for question 14 A Option A Both A and R are true, and R is the correct explanation of A. B Option B Both A and R are true, but R is not the correct explanation of A. C Option C A is true, but R is false. D Option D A is false, but R is true.
Skip Check Show the explanation Hide the explanation Next question Try again
Show the explanation Hide the explanation Answer A · Both A and R are true, and R is the correct explanation of A.
Subtracting C from both sides of AD = Y gives I = S. R explains A.
Read the two statements and choose the correct option.
I. If planned saving exceeds planned investment, income will fall.
II. If planned investment exceeds planned saving, firms' stocks pile up.
Options for question 15 A Option A Only I B Option B Only II C Option C Both I and II D Option D Neither I nor II
Skip Check Show the explanation Hide the explanation Next question Try again
Show the explanation Hide the explanation Answer A · Only I
S > I means spending falls short of output, so firms cut production. I is true.
I > S means spending exceeds output, so stocks run down, not pile up. II is false.
Read the two statements and choose the correct option.
I. At equilibrium income, saving is zero.
II. At equilibrium income, planned saving equals planned investment.
Options for question 16 A Option A Only I B Option B Only II C Option C Both I and II D Option D Neither I nor II
Skip Check Show the explanation Hide the explanation Next question Try again
Show the explanation Hide the explanation Answer B · Only II
Saving is zero at the break-even income, not at equilibrium. I is false.
S = I is the equilibrium condition. II is true.
The saving function is S = −50 + 0.25Y and planned investment is ₹100 crore. Equilibrium income is
Options for question 17 A Option A ₹150 crore B Option B ₹200 crore C Option C ₹400 crore D Option D ₹600 crore
Skip Check Show the explanation Hide the explanation Next question Try again
Show the explanation Hide the explanation Answer D · ₹600 crore
Set S = I: −50 + 0.25Y = 100.
0.25Y = 150, so Y = ₹600 crore.
Worth noting
₹400 crore forgets the −50: it solves 0.25Y = 100.
Finding equilibrium income 11 questions With C = c̄ + bY and autonomous investment Ī, equilibrium income is
Options for question 18 A Option A (c̄ + Ī) ÷ (1 − b) B Option B (c̄ + Ī) ÷ b C Option C (c̄ + Ī) × (1 − b) D Option D c̄ ÷ (1 − b)
Skip Check Show the explanation Hide the explanation Next question Try again
Show the explanation Hide the explanation Answer A · (c̄ + Ī) ÷ (1 − b)
Y = c̄ + bY + Ī, so Y − bY = c̄ + Ī.
Y = (c̄ + Ī) ÷ (1 − b).
Worth noting
c̄ ÷ (1 − b) is the break-even income, which leaves out investment.
C = 40 + 0.75Y and planned investment is ₹60 crore. Equilibrium income is
Options for question 19 A Option A ₹133 crore B Option B ₹160 crore C Option C ₹240 crore D Option D ₹400 crore
Skip Check Show the explanation Hide the explanation Next question Try again
Show the explanation Hide the explanation Answer D · ₹400 crore
Y = (40 + 60) ÷ (1 − 0.75) = 100 ÷ 0.25 = ₹400 crore.
Worth noting
₹133 crore divides by 0.75 instead of 0.25.
C = 100 + 0.8Y and planned investment is ₹50 crore. Equilibrium income is
Options for question 20 A Option A ₹187.5 crore B Option B ₹250 crore C Option C ₹500 crore D Option D ₹750 crore
Skip Check Show the explanation Hide the explanation Next question Try again
Show the explanation Hide the explanation Answer D · ₹750 crore
Y = (100 + 50) ÷ (1 − 0.8) = 150 ÷ 0.2 = ₹750 crore.
At the equilibrium level of income, which is true?
Options for question 21 A Option A Consumption = income B Option B Planned saving = planned investment and AD = output C Option C Saving = 0 D Option D Investment = consumption
Skip Check Show the explanation Hide the explanation Next question Try again
Show the explanation Hide the explanation Answer B · Planned saving = planned investment and AD = output
Both equilibrium conditions hold together.
C = Y and S = 0 describe the break-even point, not equilibrium.
The saving function is S = −20 + 0.2Y and planned investment is ₹40 crore. Equilibrium income is
Options for question 22 A Option A ₹60 crore B Option B ₹100 crore C Option C ₹200 crore D Option D ₹300 crore
Skip Check Show the explanation Hide the explanation Next question Try again
Show the explanation Hide the explanation Answer D · ₹300 crore
S = I: −20 + 0.2Y = 40, so 0.2Y = 60.
Y = ₹300 crore.
C = 60 + 0.6Y and planned investment is ₹100 crore. Equilibrium income is
Options for question 23 A Option A ₹160 crore B Option B ₹250 crore C Option C ₹266.7 crore D Option D ₹400 crore
Skip Check Show the explanation Hide the explanation Next question Try again
Show the explanation Hide the explanation Answer D · ₹400 crore
Y = (60 + 100) ÷ (1 − 0.6) = 160 ÷ 0.4 = ₹400 crore.
Worth noting
₹266.7 crore divides by 0.6, the MPC, instead of by 0.4.
C = 40 + 0.75Y and planned investment is ₹60 crore. What is consumption at equilibrium?
Options for question 24 A Option A ₹60 crore B Option B ₹300 crore C Option C ₹340 crore D Option D ₹400 crore
Skip Check Show the explanation Hide the explanation Next question Try again
Show the explanation Hide the explanation Answer C · ₹340 crore
Equilibrium Y = (40 + 60) ÷ 0.25 = 400.
C = 40 + 0.75 × 400 = ₹340 crore; saving = 60 = investment.
In an economy, equilibrium income is ₹1,000 crore, autonomous consumption is ₹100 crore and the MPC is 0.8. Planned investment is
Options for question 25 A Option A ₹80 crore B Option B ₹100 crore C Option C ₹200 crore D Option D ₹900 crore
Skip Check Show the explanation Hide the explanation Next question Try again
Show the explanation Hide the explanation Answer B · ₹100 crore
At equilibrium, Y = C + I, and C = 100 + 0.8 × 1,000 = 900.
I = 1,000 − 900 = ₹100 crore.
Worth noting
₹200 crore is saving plus autonomous consumption; saving alone is 1,000 − 900 = 100.
C = 40 + 0.75Y and investment is ₹60 crore. If income were ₹300 crore, unplanned change in inventories would be
Options for question 26 A Option A a rise of ₹25 crore B Option B a fall of ₹100 crore C Option C no change D Option D a fall of ₹25 crore
Skip Check Show the explanation Hide the explanation Next question Try again
Show the explanation Hide the explanation Answer D · a fall of ₹25 crore
AD at Y = 300: 40 + 0.75 × 300 + 60 = 325.
Spending (325) exceeds output (300) by 25, which comes out of stock: inventories fall by ₹25 crore.
Read the two statements and choose the correct option.
I. A higher MPC, with c̄ and Ī unchanged, gives a higher equilibrium income.
II. A higher autonomous investment, with the MPC unchanged, gives a higher equilibrium income.
Options for question 27 A Option A Only I B Option B Only II C Option C Both I and II D Option D Neither I nor II
Skip Check Show the explanation Hide the explanation Next question Try again
Show the explanation Hide the explanation Answer C · Both I and II
Y = (c̄ + Ī) ÷ (1 − b): a larger b shrinks the denominator. I is true.
A larger Ī raises the numerator. II is true.
Equilibrium income is ₹800 crore, the MPC is 0.75 and planned investment is ₹120 crore. Autonomous consumption is
Options for question 28 A Option A ₹80 crore B Option B ₹120 crore C Option C ₹200 crore D Option D ₹600 crore
Skip Check Show the explanation Hide the explanation Next question Try again
Show the explanation Hide the explanation Answer A · ₹80 crore
Y = (c̄ + I) ÷ (1 − MPC), so c̄ + 120 = 800 × 0.25 = 200.
c̄ = 200 − 120 = ₹80 crore.
Worth noting
₹200 crore is total autonomous spending (c̄ + I), not consumption alone.
The investment multiplier 18 questions The investment multiplier is
Options for question 29 A Option A 1 ÷ MPC B Option B 1 − MPC C Option C 1 ÷ (1 − MPC) D Option D MPC ÷ MPS
Skip Check Show the explanation Hide the explanation Next question Try again
Show the explanation Hide the explanation Answer C · 1 ÷ (1 − MPC)
k = ΔY ÷ ΔI = 1 ÷ (1 − MPC) = 1 ÷ MPS.
If the MPC is 0.75, the investment multiplier is
Options for question 30 A Option A 0.25 B Option B 1.33 C Option C 4 D Option D 7.5
Skip Check Show the explanation Hide the explanation Next question Try again
Show the explanation Hide the explanation Answer C · 4
k = 1 ÷ (1 − 0.75) = 1 ÷ 0.25 = 4.
Worth noting
1.33 is 1 ÷ 0.75, which divides by the MPC instead of the MPS.
If the MPS is 0.2, the investment multiplier is
Options for question 31 A Option A 0.2 B Option B 0.8 C Option C 1.25 D Option D 5
Skip Check Show the explanation Hide the explanation Next question Try again
Show the explanation Hide the explanation Answer D · 5
k = 1 ÷ MPS = 1 ÷ 0.2 = 5.
The MPC is 0.75 and investment rises by ₹50 crore. Income rises by
Options for question 32 A Option A ₹50 crore B Option B ₹66.7 crore C Option C ₹150 crore D Option D ₹200 crore
Skip Check Show the explanation Hide the explanation Next question Try again
Show the explanation Hide the explanation Answer D · ₹200 crore
k = 1 ÷ 0.25 = 4.
ΔY = 4 × 50 = ₹200 crore.
Worth noting
₹150 crore is the rise in consumption, not in income.
The multiplier is 5 and income rises by ₹1,000 crore. The rise in investment was
Options for question 33 A Option A ₹200 crore B Option B ₹800 crore C Option C ₹1,000 crore D Option D ₹5,000 crore
Skip Check Show the explanation Hide the explanation Next question Try again
Show the explanation Hide the explanation Answer A · ₹200 crore
ΔI = ΔY ÷ k = 1,000 ÷ 5 = ₹200 crore.
Investment rises by ₹100 crore and income rises by ₹400 crore. The MPC is
Options for question 34 A Option A 0.25 B Option B 0.75 C Option C 0.8 D Option D 4
Skip Check Show the explanation Hide the explanation Next question Try again
Show the explanation Hide the explanation Answer B · 0.75
k = 400 ÷ 100 = 4, so MPS = 1 ÷ 4 = 0.25.
MPC = 1 − 0.25 = 0.75.
The graph shows AD rising from AD₁ to AD₂ after investment rises by ₹20 crore. By how much does equilibrium income rise?
Options for question 35 A Option A ₹20 crore B Option B ₹60 crore C Option C ₹80 crore D Option D ₹480 crore
Skip Check Show the explanation Hide the explanation Next question Try again
Show the explanation Hide the explanation Answer C · ₹80 crore
Equilibrium moves from E₁ (₹400 crore) to E₂ (₹480 crore): a rise of ₹80 crore.
Worth noting
₹480 crore is the new level of income, not the rise.
Assertion (A): The larger the MPC, the larger the investment multiplier.
Reason (R): With a larger MPC, more of each round of new income is spent and becomes someone else's income.
Options for question 36 A Option A Both A and R are true, and R is the correct explanation of A. B Option B Both A and R are true, but R is not the correct explanation of A. C Option C A is true, but R is false. D Option D A is false, but R is true.
Skip Check Show the explanation Hide the explanation Next question Try again
Show the explanation Hide the explanation Answer A · Both A and R are true, and R is the correct explanation of A.
k = 1 ÷ (1 − MPC) rises with MPC, because less leaks into saving each round. R explains A.
If the MPC were 0, the investment multiplier would be
Options for question 37 A Option A 0 B Option B 1 C Option C infinite D Option D 10
Skip Check Show the explanation Hide the explanation Next question Try again
Show the explanation Hide the explanation Answer B · 1
k = 1 ÷ (1 − 0) = 1: income rises only by the extra investment, with no further rounds.
Read the two statements and choose the correct option.
I. The multiplier works in both directions: a fall in investment lowers income by a multiple of the fall.
II. The value of the multiplier lies between 1 and infinity.
Options for question 38 A Option A Only I B Option B Only II C Option C Both I and II D Option D Neither I nor II
Skip Check Show the explanation Hide the explanation Next question Try again
Show the explanation Hide the explanation Answer C · Both I and II
A cut in spending lowers incomes round after round. I is true.
With MPC between 0 and 1, k = 1 ÷ (1 − MPC) is between 1 and infinity. II is true.
A rise of ₹20 crore in autonomous consumption, with an MPC of 0.8, raises equilibrium income by
Options for question 39 A Option A ₹16 crore B Option B ₹20 crore C Option C ₹25 crore D Option D ₹100 crore
Skip Check Show the explanation Hide the explanation Next question Try again
Show the explanation Hide the explanation Answer D · ₹100 crore
Any rise in autonomous spending is multiplied: k = 1 ÷ 0.2 = 5.
ΔY = 5 × 20 = ₹100 crore.
Match each MPC with its investment multiplier.
List I List II A. MPC = 0.5 I. 5 B. MPC = 0.75 II. 2 C. MPC = 0.8 III. 10 D. MPC = 0.9 IV. 4
Options for question 40 A Option A A-II, B-I, C-III, D-IV B Option B A-I, B-II, C-IV, D-III C Option C A-IV, B-III, C-II, D-I D Option D A-II, B-IV, C-I, D-III
Skip Check Show the explanation Hide the explanation Next question Try again
Show the explanation Hide the explanation Answer D · A-II, B-IV, C-I, D-III
k = 1 ÷ (1 − MPC): 1 ÷ 0.5 = 2, 1 ÷ 0.25 = 4, 1 ÷ 0.2 = 5, 1 ÷ 0.1 = 10.
If the MPS is 0.25 and investment falls by ₹40 crore, income
Options for question 41 A Option A falls by ₹40 crore B Option B rises by ₹160 crore C Option C falls by ₹160 crore D Option D falls by ₹10 crore
Skip Check Show the explanation Hide the explanation Next question Try again
Show the explanation Hide the explanation Answer C · falls by ₹160 crore
k = 1 ÷ 0.25 = 4.
ΔY = 4 × (−40) = −₹160 crore.
The MPC is 0.9 and investment rises by ₹30 crore. Income rises by
Options for question 42 A Option A ₹27 crore B Option B ₹33.3 crore C Option C ₹270 crore D Option D ₹300 crore
Skip Check Show the explanation Hide the explanation Next question Try again
Show the explanation Hide the explanation Answer D · ₹300 crore
k = 1 ÷ (1 − 0.9) = 10.
ΔY = 10 × 30 = ₹300 crore.
Worth noting
₹270 crore is the rise in consumption, not in income.
Assertion (A): A higher MPS gives a larger investment multiplier.
Reason (R): The investment multiplier equals 1 ÷ MPS.
Options for question 43 A Option A Both A and R are true, and R is the correct explanation of A. B Option B Both A and R are true, but R is not the correct explanation of A. C Option C A is true, but R is false. D Option D A is false, but R is true.
Skip Check Show the explanation Hide the explanation Next question Try again
Show the explanation Hide the explanation Answer D · A is false, but R is true.
R is true: k = 1 ÷ MPS.
So a higher MPS gives a smaller multiplier, not a larger one. A is false.
The multiplier is 4. To raise income by ₹200 crore, investment must rise by
Options for question 44 A Option A ₹50 crore B Option B ₹150 crore C Option C ₹200 crore D Option D ₹800 crore
Skip Check Show the explanation Hide the explanation Next question Try again
Show the explanation Hide the explanation Answer A · ₹50 crore
ΔI = ΔY ÷ k = 200 ÷ 4 = ₹50 crore.
The graph shows AD rising from AD₁ to AD₂ after investment rises by ₹20 crore. What is the multiplier, and what is the MPC?
Options for question 45 A Option A Multiplier 4, MPC 0.75 B Option B Multiplier 4, MPC 0.25 C Option C Multiplier 5, MPC 0.8 D Option D Multiplier 0.25, MPC 0.75
Skip Check Show the explanation Hide the explanation Next question Try again
Show the explanation Hide the explanation Answer A · Multiplier 4, MPC 0.75
ΔY = 480 − 400 = 80 and ΔI = 20, so k = 80 ÷ 20 = 4.
1 ÷ (1 − MPC) = 4 gives MPC = 0.75.
C = 40 + 0.75Y and investment rises from ₹60 crore to ₹80 crore. The new equilibrium income is
Options for question 46 A Option A ₹80 crore B Option B ₹420 crore C Option C ₹480 crore D Option D ₹500 crore
Skip Check Show the explanation Hide the explanation Next question Try again
Show the explanation Hide the explanation Answer C · ₹480 crore
Old Y = (40 + 60) ÷ 0.25 = 400. ΔY = 4 × 20 = 80.
New Y = 400 + 80 = ₹480 crore (or (40 + 80) ÷ 0.25).
Worth noting
₹420 crore adds only the ₹20 crore of new investment and leaves out the multiplier.
The multiplier round by round 7 questions Investment rises by ₹100 crore and the MPC is 0.8. In the second round, income rises by
Options for question 47 A Option A ₹20 crore B Option B ₹64 crore C Option C ₹80 crore D Option D ₹100 crore
Skip Check Show the explanation Hide the explanation Next question Try again
Show the explanation Hide the explanation Answer C · ₹80 crore
Round 1: the ₹100 crore spent becomes income for those who produce the capital goods.
Round 2: they spend 0.8 × 100 = ₹80 crore, which becomes others' income.
Investment rises by ₹100 crore and the MPC is 0.8. When the multiplier process is complete, the total rise in consumption is
Options for question 48 A Option A ₹80 crore B Option B ₹100 crore C Option C ₹400 crore D Option D ₹500 crore
Skip Check Show the explanation Hide the explanation Next question Try again
Show the explanation Hide the explanation Answer C · ₹400 crore
ΔY = 5 × 100 = 500.
ΔC = 0.8 × 500 = ₹400 crore (equivalently ΔY − ΔI = 500 − 100).
Assertion (A): The multiplier process comes to an end even though each round adds some income.
Reason (R): Part of every round's new income leaks into saving, so each round is smaller than the one before.
Options for question 49 A Option A Both A and R are true, and R is the correct explanation of A. B Option B Both A and R are true, but R is not the correct explanation of A. C Option C A is true, but R is false. D Option D A is false, but R is true.
Skip Check Show the explanation Hide the explanation Next question Try again
Show the explanation Hide the explanation Answer A · Both A and R are true, and R is the correct explanation of A.
The rounds form a shrinking series whose total is finite: ΔI × 1 ÷ (1 − MPC). R explains A.
Read the two statements and choose the correct option.
I. In the multiplier process, one person's spending becomes another person's income.
II. In the multiplier process, the rounds of new income get larger and larger.
Options for question 50 A Option A Only I B Option B Only II C Option C Both I and II D Option D Neither I nor II
Skip Check Show the explanation Hide the explanation Next question Try again
Show the explanation Hide the explanation Answer A · Only I
That chain of spending and income is the mechanism. I is true.
Each round is MPC times the last, so the rounds shrink. II is false.
Investment rises by ₹100 crore and the MPC is 0.5. After the first two rounds, income has risen by
Options for question 51 A Option A ₹100 crore B Option B ₹150 crore C Option C ₹175 crore D Option D ₹200 crore
Skip Check Show the explanation Hide the explanation Next question Try again
Show the explanation Hide the explanation Answer B · ₹150 crore
Round 1: 100. Round 2: 0.5 × 100 = 50.
Total so far = ₹150 crore, on the way to 100 × 2 = ₹200 crore.
Worth noting
₹175 crore adds a third round of 25, one more than asked.
Investment rises by ₹100 crore and the MPC is 0.8. After the first three rounds, the total rise in income is
Options for question 52 A Option A ₹180 crore B Option B ₹244 crore C Option C ₹300 crore D Option D ₹500 crore
Skip Check Show the explanation Hide the explanation Next question Try again
Show the explanation Hide the explanation Answer B · ₹244 crore
Rounds: 100, then 0.8 × 100 = 80, then 0.8 × 80 = 64.
Total so far = 100 + 80 + 64 = ₹244 crore; it keeps growing towards ₹500 crore.
Worth noting
₹500 crore is the final total after all rounds, not after three.
Investment rises by ₹100 crore and the MPC is 0.8. When the multiplier process is complete, the total rise in saving is
Options for question 53 A Option A ₹20 crore B Option B ₹100 crore C Option C ₹400 crore D Option D ₹500 crore
Skip Check Show the explanation Hide the explanation Next question Try again
Show the explanation Hide the explanation Answer B · ₹100 crore
ΔY = 500 and MPS = 0.2, so ΔS = 0.2 × 500 = ₹100 crore.
The rise in saving equals the rise in investment, as the new equilibrium needs S = I.
Worth noting
₹20 crore is the saving out of the first round only.
The paradox of thrift 5 questions The paradox of thrift says that if everyone in an economy tries to save more,
Options for question 54 A Option A total saving may not rise, because income falls B Option B total saving rises by the full amount planned C Option C income rises D Option D investment rises automatically
Skip Check Show the explanation Hide the explanation Next question Try again
Show the explanation Hide the explanation Answer A · total saving may not rise, because income falls
More saving means less consumption, so AD and income fall.
At the lower income, saving is back to equal planned investment, which has not changed.
Read the two statements and choose the correct option.
I. A greater desire to save by everyone can lower national income.
II. With investment fixed, total saving at the new equilibrium equals that investment.
Options for question 55 A Option A Only I B Option B Only II C Option C Both I and II D Option D Neither I nor II
Skip Check Show the explanation Hide the explanation Next question Try again
Show the explanation Hide the explanation Answer C · Both I and II
Lower consumption cuts AD and income. I is true.
Equilibrium needs S = I, and I has not changed. II is true.
C = 40 + 0.75Y and investment is fixed at ₹60 crore. Households become thriftier and autonomous consumption falls to ₹20 crore. What happens to equilibrium income and total saving?
Options for question 56 A Option A Income stays at ₹400 crore; saving rises to ₹80 crore B Option B Income falls to ₹380 crore; saving rises to ₹80 crore C Option C Income rises to ₹480 crore; saving stays at ₹60 crore D Option D Income falls from ₹400 crore to ₹320 crore; saving stays at ₹60 crore
Skip Check Show the explanation Hide the explanation Next question Try again
Show the explanation Hide the explanation Answer D · Income falls from ₹400 crore to ₹320 crore; saving stays at ₹60 crore
New Y = (20 + 60) ÷ 0.25 = 320, down from 400.
At equilibrium S = I = 60, so total saving is unchanged although every household tried to save more.
Assertion (A): What is good for one household, saving more, can be bad for the economy as a whole.
Reason (R): If all households cut consumption together, aggregate demand and income fall.
Options for question 57 A Option A Both A and R are true, and R is the correct explanation of A. B Option B Both A and R are true, but R is not the correct explanation of A. C Option C A is true, but R is false. D Option D A is false, but R is true.
Skip Check Show the explanation Hide the explanation Next question Try again
Show the explanation Hide the explanation Answer A · Both A and R are true, and R is the correct explanation of A.
One household's extra saving does not change national income, but everyone's does. R explains A.
Autonomous consumption is ₹40 crore and investment is fixed at ₹60 crore. Households raise their MPS from 0.2 to 0.25. Equilibrium income
Options for question 58 A Option A rises from ₹400 crore to ₹500 crore B Option B stays at ₹500 crore and saving rises to ₹125 crore C Option C falls to ₹400 crore and saving rises to ₹100 crore D Option D falls from ₹500 crore to ₹400 crore, and saving stays at ₹60 crore
Skip Check Show the explanation Hide the explanation Back to start Try again
Show the explanation Hide the explanation Answer D · falls from ₹500 crore to ₹400 crore, and saving stays at ₹60 crore
Before: Y = (40 + 60) ÷ 0.2 = 500. After: Y = 100 ÷ 0.25 = 400.
Saving: −40 + 0.2 × 500 = 60 before, −40 + 0.25 × 400 = 60 after: unchanged.
Question types · easy to hard
NTA's Economics syllabus is three courses: Introductory Microeconomics, Introductory Macroeconomics and Indian Economic Development, each split into units with a list of topics. It prints no chapters and no split of the 50 questions across the courses. So the areas here are NTA's three courses, and the chapters inside them are ours: a unit that covers several ideas, such as consumer behaviour and demand, is split into a chapter for each, so that a chapter can be practised in one sitting. All three courses are here.