EduFarming
Your list · 0हिं

Type at least two letters. Press Esc to close.

↑↓ navigate↵ openTAB cycle filter

Income Determination & the Multiplier · Question 12 of 58

The graph shows the saving and investment lines.

Question 12

MediumOriginal question

The graph shows the saving and investment lines. Equilibrium income is
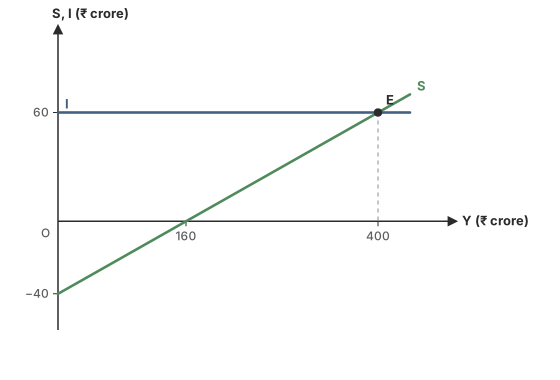
A saving line S starting at −₹40 crore and rising, and a horizontal investment line I at ₹60 crore. They meet at E, where income is ₹400 crore and saving equals investment at ₹60 crore. The saving line crosses the income axis at ₹160 crore.
Options for question 12

Show the answer and explanation
CorrectNot quiteAnswer D

Correct answer: D

Explanation

  1. Equilibrium is where S meets I, at E.

  2. E is at an income of ₹400 crore.

Worth noting

₹160 crore is the break-even income, where S = 0.

Concept
Equilibrium from S and I
Typical time
70 s
Your time
—
The rule this testsEquilibrium: saving equals investment
Practise this chapter →

Ten questions from Income Determination & the Multiplier, at your own pace.

Practise this chapter →

Ten questions from Income Determination & the Multiplier, at your own pace.