Question 5
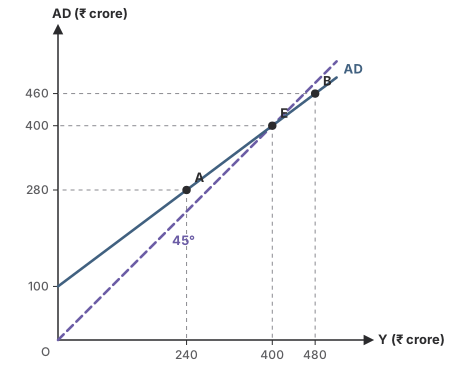
MediumOriginal questionThe graph shows the AD line and the 45° line. At an income of ₹480 crore (point B), what happens?
Show the answer and explanation
CorrectNot quiteAnswer A
Correct answer: A
Explanation
At Y = 480, AD = 460 (point B lies below the 45° line).
Output is 20 more than planned spending, so unplanned stock builds up and firms cut output towards E.
Worth noting
₹80 crore is the gap between 480 and equilibrium 400, not the gap between output and AD at 480.
- Concept
- Above equilibrium
- Typical timeTypical
- 70 s
- Your timeYours
- —
Practise this chapter →
Ten questions from Income Determination & the Multiplier, at your own pace.