Question 15
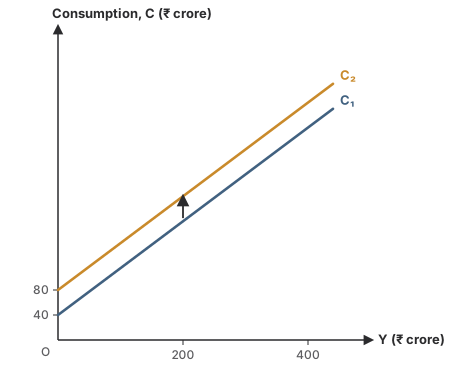
MediumOriginal questionThe graph shows two consumption functions, C₁ and C₂. The move from C₁ to C₂ is caused by
Show the answer and explanation
CorrectNot quiteAnswer C
Correct answer: C
Explanation
The lines are parallel, so the slope (MPC) is the same.
C₂ starts higher, at ₹80 crore instead of ₹40 crore: autonomous consumption has risen.
Worth noting
A rise in income is a movement along one line, not a shift to another.
- Concept
- Shift of the consumption function
- Typical timeTypical
- 70 s
- Your timeYours
- —
Practise this chapter →
Ten questions from Aggregate Demand, Consumption & Saving, at your own pace.