Question 9
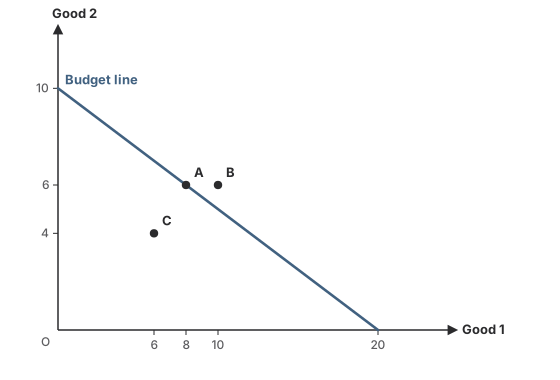
MediumOriginal questionIn the graph, what is the slope of the budget line?
Show the answer and explanation
CorrectNot quiteAnswer D
Correct answer: D
Explanation
Slope = −P₁ ÷ P₂ = −5 ÷ 10 = −0.5.
Check from the intercepts: −10 ÷ 20 = −0.5. Half a unit of good 2 is given up for each unit of good 1.
Worth noting
−2 inverts the ratio: it is the slope with good 2 on the horizontal axis.
- Concept
- Slope from prices and intercepts
- Typical timeTypical
- 70 s
- Your timeYours
- —
Practise this chapter →
Ten questions from Budget Line & Optimal Choice, at your own pace.