On this page · 8 sections 01 The core idea 02 The budget line 03 Indifference curves 04 The consumer's optimum 05 Exam shortcuts 06 Common mistakes 07 Quick revision 08 Check your understanding Two things decide what a consumer buys: what he can afford and what he likes . The budget line draws the first, indifference curves draw the second, and the best affordable bundle is where the budget line just touches the highest indifference curve it can reach.
This approach only ranks bundles (better, worse, equal); it never needs to count utils. That is why it is called the ordinal approach.
With income M and prices P₁ and P₂, the budget set is every bundle the consumer can buy: P₁x₁ + P₂x₂ ≤ M. The budget line is the bundles that cost exactly M.
Example 1 · Drawing a budget line
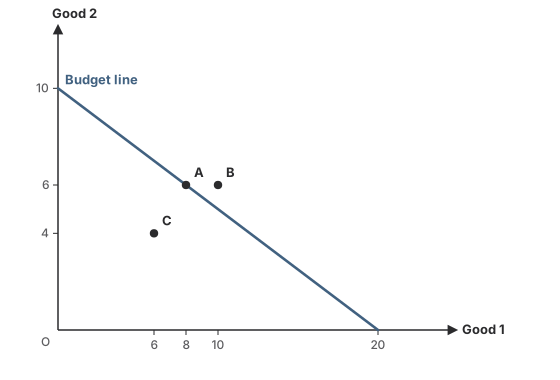
M = ₹100, P₁ = ₹5, P₂ = ₹10. Find the intercepts and slope, and test the bundle (8, 6).
Most of good 1: 100 ÷ 5 = 20. Most of good 2: 100 ÷ 10 = 10.
Slope = −5 ÷ 10 = −0.5: half a unit of good 2 for each unit of good 1.
(8, 6) costs 40 + 60 = ₹100: it lies on the line.
Answer Intercepts 20 and 10; slope −0.5; (8, 6) is on the line
A bundle inside the line leaves money unspent; one outside it costs more than M.
Change What happens to the line Income rises Shifts out, parallel Income falls Shifts in, parallel P₁ falls Rotates out on the good-1 axis (good-2 intercept fixed) P₂ rises Rotates in on the good-2 axis (good-1 intercept fixed) M, P₁ and P₂ all double No change
A fall in the price of good 1 swings the line out along the good-1 axis. A curve joining bundles that give the consumer the same satisfaction. A set of them is an indifference map.
With monotonic preferences (more is better), indifference curves:
slope downward: more of one good must come with less of the other to keep satisfaction the same;
are convex to the origin, because the MRS diminishes;
never cut each other;
show more satisfaction the higher they are.
The units of good 2 the consumer is willing to give up for one more unit of good 1, staying equally well off. It is the slope of the indifference curve.
Example 2 · Diminishing MRS
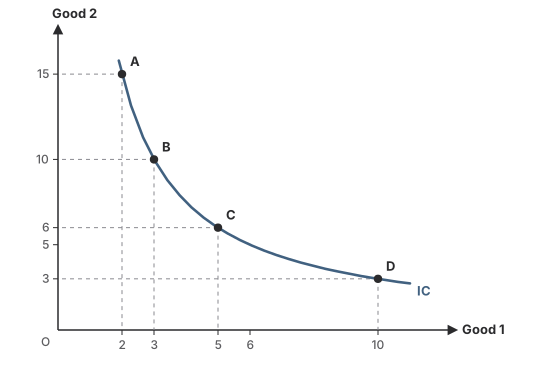
On one indifference curve lie (2, 15), (3, 10), (5, 6) and (10, 3). Find the MRS between each pair.
(2, 15) to (3, 10): 5 of good 2 for 1 of good 1, MRS = 5.
(3, 10) to (5, 6): 4 for 2, MRS = 2.
(5, 6) to (10, 3): 3 for 5, MRS = 0.6.
Answer MRS falls: 5, 2, 0.6, so the curve is convex
The MRS is the consumer's own rate of exchange. The market's rate is the price ratio, the slope of the budget line. Do not mix the two up, or MRS with the MRT of a PPC.
On the budget line, at the point where it just touches the highest indifference curve it can reach. There the two slopes are equal.
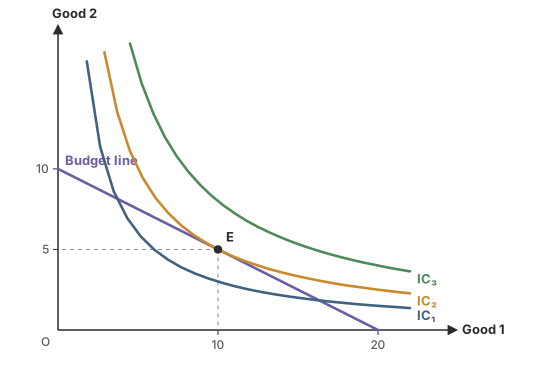
IC₃ is out of reach and IC₁ is beaten by moving along the line; the optimum is E on IC₂. If MRS is greater than P₁ ÷ P₂, the consumer values good 1 more than the market charges for it, so he should buy more of good 1; if less, buy less. He moves until the two are equal.
A point inside the budget line is never the optimum: with money left, more of something raises satisfaction.
Slope of the budget line = P₁ ÷ P₂; slope of an indifference curve = MRS.
Income change: parallel shift. One price change: rotation on the other good's axis.
Optimum: MRS = P₁ ÷ P₂ on the budget line, on a convex indifference curve.
Inverting the slope: with good 1 on the horizontal axis it is P₁ ÷ P₂, not P₂ ÷ P₁.
Saying a price fall shifts the budget line in parallel. Only an income change does that.
Choosing a point where an indifference curve cuts the line: moving along the line reaches a higher curve.
Budget line
P₁x₁ + P₂x₂ = M; intercepts M ÷ P₁ and M ÷ P₂
Income moves it parallel; a price rotates it
Inside: money left; outside: unaffordable
Indifference curves
Same satisfaction along one curve
Downward sloping, convex, never cross
Slope = MRS, which diminishes
Optimum
Highest curve the line touches
MRS = P₁ ÷ P₂
How the choice responds to price, income and other goods is the subject of demand and its determinants .
Next · 07 Quick revision → Check your understanding 67 questions, grouped by type, easy to hard. Pick an answer and check it. The worked solution opens when you ask for it.
Budget set and budget line Q1 of 67 Q1
Budget set and budget line 18 questions A consumer's budget set is
Options for question 1 A Option A only the bundles that cost exactly his income B Option B all the bundles he can buy with his income at the given prices C Option C all the bundles he likes equally D Option D the bundles the government allows him to buy
Skip Check Show the explanation Hide the explanation Next question Try again
Show the explanation Hide the explanation Answer B · all the bundles he can buy with his income at the given prices
The budget set is every bundle with P₁x₁ + P₂x₂ ≤ M: on or inside the budget line.
Bundles costing exactly M form the budget line, a part of the set.
Worth noting
Bundles liked equally lie on an indifference curve, a different idea.
The equation of a budget line is
Options for question 2 A Option A P₁x₁ + P₂x₂ < M B Option B x₁ + x₂ = M C Option C P₁ + P₂ = M D Option D P₁x₁ + P₂x₂ = M
Skip Check Show the explanation Hide the explanation Next question Try again
Show the explanation Hide the explanation Answer D · P₁x₁ + P₂x₂ = M
Spending on good 1 plus spending on good 2 equals the whole income M.
A bundle that lies outside the budget line is
Options for question 3 A Option A affordable, with some income left over B Option B affordable, using the whole income C Option C not affordable with the given income D Option D preferred to every bundle on the line
Skip Check Show the explanation Hide the explanation Next question Try again
Show the explanation Hide the explanation Answer C · not affordable with the given income
Outside the line, the bundle costs more than M, so it is not in the budget set.
The budget line is also called the
Options for question 4 A Option A demand line B Option B indifference line C Option C price line D Option D production line
Skip Check Show the explanation Hide the explanation Next question Try again
Show the explanation Hide the explanation Answer C · price line
Its slope is set by the prices of the two goods, so it is also called the price line.
The slope of a budget line, with good 1 on the horizontal axis, is
Options for question 5 A Option A −P₁ ÷ P₂ B Option B −P₂ ÷ P₁ C Option C M ÷ P₁ D Option D P₁ × P₂
Skip Check Show the explanation Hide the explanation Next question Try again
Show the explanation Hide the explanation Answer A · −P₁ ÷ P₂
Rewrite the line: x₂ = M ÷ P₂ − (P₁ ÷ P₂) x₁.
The coefficient of x₁, −P₁ ÷ P₂, is the slope: the units of good 2 given up to buy one more unit of good 1.
Worth noting
−P₂ ÷ P₁ is the slope if good 2 is put on the horizontal axis instead.
A consumer has ₹100. Good 1 costs ₹5 and good 2 costs ₹10. What is the most of good 1 he can buy?
Options for question 6 A Option A 10 units B Option B 15 units C Option C 20 units D Option D 500 units
Skip Check Show the explanation Hide the explanation Next question Try again
Show the explanation Hide the explanation Answer C · 20 units
Spending everything on good 1: M ÷ P₁ = 100 ÷ 5 = 20 units.
This is where the budget line meets the good-1 axis.
Worth noting
10 is the most of good 2 (100 ÷ 10).
In the graph, which bundles can the consumer afford?
Options for question 7 A Option A A, B and C B Option B Only B C Option C A and C D Option D Only C
Skip Check Show the explanation Hide the explanation Next question Try again
Show the explanation Hide the explanation Answer C · A and C
A costs 8 × ₹5 + 6 × ₹10 = ₹100: on the budget line, affordable.
C costs 6 × ₹5 + 4 × ₹10 = ₹70: inside the line, affordable. B costs 10 × ₹5 + 6 × ₹10 = ₹110: beyond the income.
In the graph, how much of the ₹100 income is left over if the consumer buys bundle C?
Options for question 8 A Option A ₹0 B Option B ₹10 C Option C ₹30 D Option D ₹70
Skip Check Show the explanation Hide the explanation Next question Try again
Show the explanation Hide the explanation Answer C · ₹30
C (6, 4) costs 6 × ₹5 + 4 × ₹10 = ₹70.
Income left = ₹100 − ₹70 = ₹30.
In the graph, what is the slope of the budget line?
Options for question 9 A Option A −20 B Option B −10 C Option C −2 D Option D −0.5
Skip Check Show the explanation Hide the explanation Next question Try again
Show the explanation Hide the explanation Answer D · −0.5
Slope = −P₁ ÷ P₂ = −5 ÷ 10 = −0.5.
Check from the intercepts: −10 ÷ 20 = −0.5. Half a unit of good 2 is given up for each unit of good 1.
Worth noting
−2 inverts the ratio: it is the slope with good 2 on the horizontal axis.
Which bundle lies on the budget line 4x₁ + 5x₂ = 40?
Options for question 10 A Option A (4, 5) B Option B (5, 4) C Option C (6, 4) D Option D (10, 2)
Skip Check Show the explanation Hide the explanation Next question Try again
Show the explanation Hide the explanation Answer B · (5, 4)
(5, 4): 4 × 5 + 5 × 4 = 20 + 20 = 40. It spends exactly the income.
(4, 5) costs 41, (6, 4) costs 44 and (10, 2) costs 50, all more than 40.
A budget line is drawn for an income of ₹60 with good 1 on the horizontal axis. It meets that axis at 12 units and the other axis at 20 units. What are the two prices?
Options for question 11 A Option A P₁ = ₹5 and P₂ = ₹3 B Option B P₁ = ₹3 and P₂ = ₹5 C Option C P₁ = ₹12 and P₂ = ₹20 D Option D P₁ = ₹60 and P₂ = ₹60
Skip Check Show the explanation Hide the explanation Next question Try again
Show the explanation Hide the explanation Answer A · P₁ = ₹5 and P₂ = ₹3
Horizontal intercept = M ÷ P₁, so P₁ = 60 ÷ 12 = ₹5.
Vertical intercept = M ÷ P₂, so P₂ = 60 ÷ 20 = ₹3.
Worth noting
Swapping them divides by the wrong intercept: the axis of good 1 gives its price.
Assertion (A): A budget line slopes downward.
Reason (R): With a fixed income, buying more of one good means buying less of the other.
Options for question 12 A Option A Both A and R are true, and R is the correct explanation of A. B Option B Both A and R are true, but R is not the correct explanation of A. C Option C A is true, but R is false. D Option D A is false, but R is true.
Skip Check Show the explanation Hide the explanation Next question Try again
Show the explanation Hide the explanation Answer A · Both A and R are true, and R is the correct explanation of A.
Both are true.
The trade-off R describes is what gives the line its negative slope, so R explains A.
Read the two statements and choose the correct option.
I. Every bundle on the budget line costs the same amount.
II. Every bundle on the budget line gives the same satisfaction.
Options for question 13 A Option A Only I B Option B Only II C Option C Both I and II D Option D Neither I nor II
Skip Check Show the explanation Hide the explanation Next question Try again
Show the explanation Hide the explanation Answer A · Only I
I is true: each costs exactly M.
II is false: equal satisfaction is the property of an indifference curve, not of the budget line.
A consumer has ₹50; P₁ = ₹5 and P₂ = ₹10. How many bundles with whole-number quantities lie exactly on the budget line?
Options for question 14 A Option A 5 B Option B 6 C Option C 10 D Option D 11
Skip Check Show the explanation Hide the explanation Next question Try again
Show the explanation Hide the explanation Answer B · 6
The line is 5x₁ + 10x₂ = 50, or x₁ + 2x₂ = 10.
x₂ can be 0, 1, 2, 3, 4 or 5, each with x₁ = 10 − 2x₂ a whole number: 6 bundles.
Worth noting
11 counts every value of x₁ from 0 to 10, but odd values of x₁ give half units of good 2.
The budget line of a consumer is 2x₁ + 4x₂ = 40. If he buys 10 units of good 1, how much of good 2 can he buy at most?
Options for question 15 A Option A 2.5 units B Option B 5 units C Option C 10 units D Option D 20 units
Skip Check Show the explanation Hide the explanation Next question Try again
Show the explanation Hide the explanation Answer B · 5 units
10 units of good 1 cost 2 × 10 = ₹20, leaving ₹20.
₹20 ÷ ₹4 = 5 units of good 2.
A consumer has ₹60; P₁ = ₹6 and P₂ = ₹4. Which bundle is affordable but leaves money unspent?
Options for question 16 A Option A (6, 6), costing ₹60 B Option B (8, 4), costing ₹64 C Option C (4, 8), costing ₹56 D Option D (10, 2), costing ₹68
Skip Check Show the explanation Hide the explanation Next question Try again
Show the explanation Hide the explanation Answer C · (4, 8), costing ₹56
(4, 8): 24 + 32 = ₹56 < 60, inside the budget line.
(6, 6) costs exactly ₹60 (on the line); the other two cost more than ₹60.
Assertion (A): A budget line is a straight line.
Reason (R): The consumer's tastes do not change along the budget line.
Options for question 17 A Option A Both A and R are true, and R is the correct explanation of A. B Option B Both A and R are true, but R is not the correct explanation of A. C Option C A is true, but R is false. D Option D A is false, but R is true.
Skip Check Show the explanation Hide the explanation Next question Try again
Show the explanation Hide the explanation Answer B · Both A and R are true, but R is not the correct explanation of A.
A is true: with fixed prices, the trade-off between the goods is the same everywhere on the line.
R is not about the budget line at all: the line depends only on income and prices. So R does not explain A.
Worth noting
The reason the line is straight is that prices are fixed whatever quantity is bought.
A budget line passes through (2, 8) and (6, 4), with income ₹40. What are P₁ and P₂?
Options for question 18 A Option A P₁ = ₹2 and P₂ = ₹4 B Option B P₁ = ₹4 and P₂ = ₹4 C Option C P₁ = ₹4 and P₂ = ₹2 D Option D P₁ = ₹5 and P₂ = ₹5
Skip Check Show the explanation Hide the explanation Next question Try again
Show the explanation Hide the explanation Answer B · P₁ = ₹4 and P₂ = ₹4
Moving from (2, 8) to (6, 4): 4 more of good 1 for 4 less of good 2, so P₁ = P₂.
2P₁ + 8P₂ = 40 with P₁ = P₂ gives 10P = 40, so both prices are ₹4.
When income or prices change 15 questions If a consumer's income rises and prices stay the same, the budget line
Options for question 19 A Option A rotates outward along the good-1 axis B Option B shifts inward, parallel to itself C Option C does not change D Option D shifts outward, parallel to itself
Skip Check Show the explanation Hide the explanation Next question Try again
Show the explanation Hide the explanation Answer D · shifts outward, parallel to itself
Both intercepts M ÷ P₁ and M ÷ P₂ rise with M.
The slope −P₁ ÷ P₂ is unchanged, so the new line is parallel and further out.
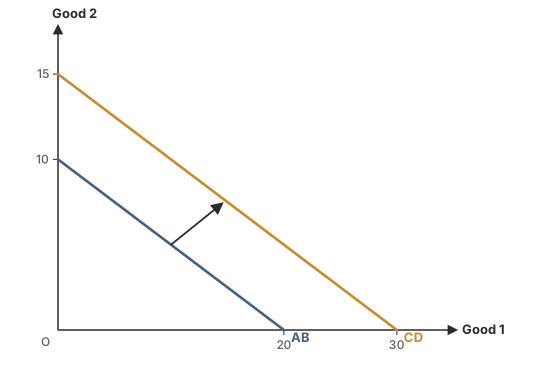
The budget line moves from AB to CD as shown. Prices are ₹5 for good 1 and ₹10 for good 2. What has happened to income?
Options for question 20 A Option A It has risen from ₹100 to ₹300 B Option B It has fallen from ₹150 to ₹100 C Option C It has risen from ₹100 to ₹150 D Option D It is unchanged; prices have fallen
Skip Check Show the explanation Hide the explanation Next question Try again
Show the explanation Hide the explanation Answer C · It has risen from ₹100 to ₹150
Old income = 20 × ₹5 = ₹100 (or 10 × ₹10). New income = 30 × ₹5 = ₹150 (or 15 × ₹10).
A parallel outward shift with prices given means income rose.
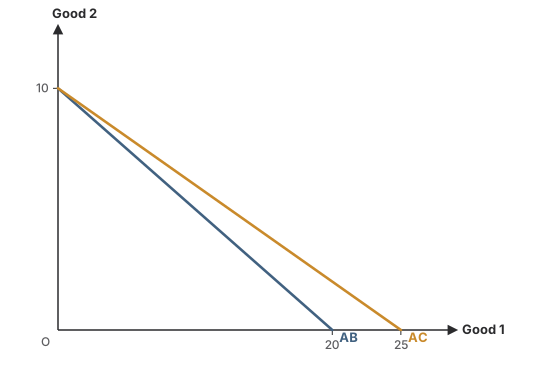
The budget line swings from AB to AC as shown. What has happened?
Options for question 21 A Option A The price of good 1 has fallen B Option B The price of good 2 has fallen C Option C Income has risen D Option D The price of good 1 has risen
Skip Check Show the explanation Hide the explanation Next question Try again
Show the explanation Hide the explanation Answer A · The price of good 1 has fallen
The good-2 intercept (10) is unchanged, so income and P₂ are unchanged.
The good-1 intercept rises from 20 to 25, so more of good 1 can be bought: P₁ has fallen.
If the prices of both goods and the consumer's income all double, the budget line
Options for question 22 A Option A shifts outward B Option B does not change C Option C shifts inward D Option D becomes steeper
Skip Check Show the explanation Hide the explanation Next question Try again
Show the explanation Hide the explanation Answer B · does not change
Intercepts: 2M ÷ 2P₁ = M ÷ P₁ and 2M ÷ 2P₂ = M ÷ P₂, unchanged.
Slope: −2P₁ ÷ 2P₂ = −P₁ ÷ P₂, unchanged. The line stays where it was.
If the price of good 2 (on the vertical axis) rises while income and P₁ stay the same, the budget line
Options for question 23 A Option A rotates outward around its good-1 intercept B Option B shifts inward in parallel C Option C rotates around its good-2 intercept D Option D rotates inward around its good-1 intercept
Skip Check Show the explanation Hide the explanation Next question Try again
Show the explanation Hide the explanation Answer D · rotates inward around its good-1 intercept
M ÷ P₂ falls, so the good-2 intercept moves down.
M ÷ P₁ is unchanged, so the line pivots on the good-1 axis and becomes flatter.
Assertion (A): A fall in income shifts the budget line inward, parallel to the old line.
Reason (R): The slope of the budget line depends only on the two prices.
Options for question 24 A Option A Both A and R are true, and R is the correct explanation of A. B Option B Both A and R are true, but R is not the correct explanation of A. C Option C A is true, but R is false. D Option D A is false, but R is true.
Skip Check Show the explanation Hide the explanation Next question Try again
Show the explanation Hide the explanation Answer A · Both A and R are true, and R is the correct explanation of A.
Both are true.
Because the slope depends only on prices, an income change moves the line without tilting it: R explains why the shift is parallel.
Assertion (A): A fall in the price of good 1 shifts the budget line outward, parallel to itself.
Reason (R): A fall in P₁ raises the most of good 1 the consumer can buy.
Options for question 25 A Option A Both A and R are true, and R is the correct explanation of A. B Option B Both A and R are true, but R is not the correct explanation of A. C Option C A is true, but R is false. D Option D A is false, but R is true.
Skip Check Show the explanation Hide the explanation Next question Try again
Show the explanation Hide the explanation Answer D · A is false, but R is true.
A is false: only the good-1 intercept moves, so the line rotates; it does not shift in parallel.
R is true: M ÷ P₁ rises.
A consumer's income falls from ₹200 to ₹150 while P₁ = ₹10 and P₂ = ₹5 stay fixed. The good-2 intercept of the budget line moves from
Options for question 26 A Option A 40 to 30 B Option B 20 to 15 C Option C 40 to 15 D Option D 30 to 40
Skip Check Show the explanation Hide the explanation Next question Try again
Show the explanation Hide the explanation Answer A · 40 to 30
Good-2 intercept = M ÷ P₂: 200 ÷ 5 = 40 before, 150 ÷ 5 = 30 after.
Worth noting
20 to 15 is the good-1 intercept (M ÷ ₹10).
Read the two statements and choose the correct option.
I. A rise in income makes the budget set larger.
II. A rise in the price of either good makes the budget set smaller.
Options for question 27 A Option A Only I B Option B Only II C Option C Both I and II D Option D Neither I nor II
Skip Check Show the explanation Hide the explanation Next question Try again
Show the explanation Hide the explanation Answer C · Both I and II
Higher income pushes the line out, adding bundles: I is true.
A higher price pulls one intercept in, removing bundles: II is true.
Income stays at ₹100 and P₂ stays at ₹10, but P₁ rises from ₹5 to ₹10. The good-1 intercept of the budget line moves from
Options for question 28 A Option A 20 to 10, and the line becomes steeper B Option B 10 to 20, and the line becomes flatter C Option C 20 to 10, and the line becomes flatter D Option D it does not move
Skip Check Show the explanation Hide the explanation Next question Try again
Show the explanation Hide the explanation Answer A · 20 to 10, and the line becomes steeper
M ÷ P₁: 100 ÷ 5 = 20 before, 100 ÷ 10 = 10 after.
Slope P₁ ÷ P₂ rises from 0.5 to 1: the line pivots inward on the good-2 axis and gets steeper.
Read the two statements and choose the correct option.
I. A fall in P₁ lets the consumer buy more of good 1 even if he buys the same amount of good 2.
II. A fall in P₁ changes the most of good 2 the consumer can buy.
Options for question 29 A Option A Only I B Option B Only II C Option C Both I and II D Option D Neither I nor II
Skip Check Show the explanation Hide the explanation Next question Try again
Show the explanation Hide the explanation Answer A · Only I
I is true: money saved on good 1 buys more of it.
II is false: the most of good 2, M ÷ P₂, does not depend on P₁.
In the graph, income is ₹100. Before the change, good 1 cost ₹5. What does it cost after the budget line moves to AC?
Options for question 30 A Option A ₹2.5 B Option B ₹4 C Option C ₹5 D Option D ₹25
Skip Check Show the explanation Hide the explanation Next question Try again
Show the explanation Hide the explanation Answer B · ₹4
On AC, the most of good 1 is 25 units, so P₁ = M ÷ 25 = 100 ÷ 25 = ₹4.
A consumer has ₹120; P₁ = ₹6 and P₂ = ₹4. Income rises to ₹180 and P₁ rises to ₹9. What happens to the budget line?
Options for question 31 A Option A The good-1 intercept stays at 20; the good-2 intercept rises from 30 to 45 B Option B Both intercepts rise by half C Option C Nothing changes D Option D The good-1 intercept rises from 20 to 30
Skip Check Show the explanation Hide the explanation Next question Try again
Show the explanation Hide the explanation Answer A · The good-1 intercept stays at 20; the good-2 intercept rises from 30 to 45
Good-1 intercept: before 120 ÷ 6 = 20, after 180 ÷ 9 = 20, unchanged.
Good-2 intercept: before 120 ÷ 4 = 30, after 180 ÷ 4 = 45. The line pivots outward on the good-1 axis.
Read the two statements and choose the correct option.
I. If only P₂ falls, the budget line becomes steeper.
II. If only P₁ falls, the budget line becomes flatter.
Options for question 32 A Option A Only I B Option B Only II C Option C Both I and II D Option D Neither I nor II
Skip Check Show the explanation Hide the explanation Next question Try again
Show the explanation Hide the explanation Answer C · Both I and II
The slope's size is P₁ ÷ P₂. A lower P₂ raises it (steeper): I is true.
A lower P₁ lowers it (flatter): II is true.
Assertion (A): A 10% rise in income with a 10% rise in both prices leaves the budget set unchanged.
Reason (R): The budget line depends only on M ÷ P₁ and M ÷ P₂.
Options for question 33 A Option A Both A and R are true, and R is the correct explanation of A. B Option B Both A and R are true, but R is not the correct explanation of A. C Option C A is true, but R is false. D Option D A is false, but R is true.
Skip Check Show the explanation Hide the explanation Next question Try again
Show the explanation Hide the explanation Answer A · Both A and R are true, and R is the correct explanation of A.
Both are true, and R explains A: equal percentage rises leave both ratios, and so both intercepts, unchanged.
Indifference curves and MRS 18 questions An indifference curve shows
Options for question 34 A Option A bundles of two goods that cost the same B Option B bundles of two goods an economy can produce C Option C how demand changes with price D Option D bundles of two goods that give the consumer the same satisfaction
Skip Check Show the explanation Hide the explanation Next question Try again
Show the explanation Hide the explanation Answer D · bundles of two goods that give the consumer the same satisfaction
The consumer is indifferent among all bundles on one curve: each is as good as any other.
Bundles costing the same lie on a budget line; what can be produced lies on a PPC.
Options for question 35 A Option A always cut each other once B Option B cut each other on the axes C Option C are always parallel straight lines D Option D can never cut each other
Skip Check Show the explanation Hide the explanation Next question Try again
Show the explanation Hide the explanation Answer D · can never cut each other
If they crossed, the crossing bundle would give two different levels of satisfaction at once, which is impossible.
A higher indifference curve shows
Options for question 36 A Option A a higher level of satisfaction B Option B a lower level of satisfaction C Option C the same satisfaction as a lower curve D Option D a higher income
Skip Check Show the explanation Hide the explanation Next question Try again
Show the explanation Hide the explanation Answer A · a higher level of satisfaction
With monotonic preferences, more of at least one good and no less of the other is better.
A higher curve has such bundles, so it means more satisfaction.
Worth noting
An indifference curve does not show income; a budget line does.
An indifference curve is convex to the origin because
Options for question 37 A Option A the marginal rate of substitution rises along it B Option B the marginal rate of substitution diminishes along it C Option C the prices of the goods are fixed D Option D the consumer's income is fixed
Skip Check Show the explanation Hide the explanation Next question Try again
Show the explanation Hide the explanation Answer B · the marginal rate of substitution diminishes along it
As the consumer has more of good 1 and less of good 2, he gives up fewer units of good 2 for each extra unit of good 1.
A falling MRS makes the curve flatter as it moves right: convex to the origin.
Worth noting
A rising rate gives a concave shape, as with the PPC's MRT.
In the graph, what is the MRS of good 1 for good 2 when the consumer moves from A to B?
Options for question 38 A Option A 2 units of good 2 per unit of good 1 B Option B 10 units of good 2 per unit of good 1 C Option C 5 units of good 2 per unit of good 1 D Option D 1 unit of good 2 per unit of good 1
Skip Check Show the explanation Hide the explanation Next question Try again
Show the explanation Hide the explanation Answer C · 5 units of good 2 per unit of good 1
From A (2, 15) to B (3, 10): good 1 rises by 1, good 2 falls by 5.
MRS = ΔY ÷ ΔX = 5 ÷ 1 = 5 units of good 2 per unit of good 1.
In the graph, what is the MRS when the consumer moves from B to C?
Options for question 39 A Option A 4 units of good 2 per unit of good 1 B Option B 5 units of good 2 per unit of good 1 C Option C 2 units of good 2 per unit of good 1 D Option D 0.5 unit of good 2 per unit of good 1
Skip Check Show the explanation Hide the explanation Next question Try again
Show the explanation Hide the explanation Answer C · 2 units of good 2 per unit of good 1
From B (3, 10) to C (5, 6): good 1 rises by 2, good 2 falls by 4.
MRS = 4 ÷ 2 = 2 units of good 2 per unit of good 1, lower than the 5 from A to B: the MRS diminishes.
Worth noting
4 is the total fall in good 2, not the fall per unit of good 1.
In the graph, the MRS falls from 5 (A to B) to 2 (B to C) and then to 0.6 (C to D). This shows that
Options for question 40 A Option A the price of good 1 is falling B Option B the consumer values each extra unit of good 1 less as he has more of it C Option C the consumer's income is rising D Option D good 2 is becoming cheaper
Skip Check Show the explanation Hide the explanation Next question Try again
Show the explanation Hide the explanation Answer B · the consumer values each extra unit of good 1 less as he has more of it
Moving down the curve the consumer has more good 1 and less good 2, so he will part with less good 2 for each further unit of good 1.
C to D: good 2 falls by 3 while good 1 rises by 5, so MRS = 3 ÷ 5 = 0.6.
Preferences are called monotonic when
Options for question 41 A Option A the consumer likes both goods equally B Option B the consumer's tastes never change C Option C prices never change D Option D a bundle with more of at least one good and no less of the other is preferred
Skip Check Show the explanation Hide the explanation Next question Try again
Show the explanation Hide the explanation Answer D · a bundle with more of at least one good and no less of the other is preferred
Monotonic preferences mean more is better: a bundle with more of something, and less of nothing, ranks higher.
A set of indifference curves for one consumer is called
Options for question 42 A Option A an indifference map B Option B a budget set C Option C a production function D Option D a demand schedule
Skip Check Show the explanation Hide the explanation Next question Try again
Show the explanation Hide the explanation Answer A · an indifference map
An indifference map shows many indifference curves, each for a different level of satisfaction.
An indifference curve slopes downward because
Options for question 43 A Option A the prices of both goods fall B Option B income falls along the curve C Option C to keep satisfaction the same, more of one good must come with less of the other D Option D the consumer dislikes one of the goods
Skip Check Show the explanation Hide the explanation Next question Try again
Show the explanation Hide the explanation Answer C · to keep satisfaction the same, more of one good must come with less of the other
With monotonic preferences, more of good 1 alone would raise satisfaction.
To stay on the same curve, the consumer must give up some of good 2: a downward slope.
Assertion (A): An indifference curve is concave to the origin.
Reason (R): The MRS falls as the consumer moves down an indifference curve.
Options for question 44 A Option A Both A and R are true, and R is the correct explanation of A. B Option B Both A and R are true, but R is not the correct explanation of A. C Option C A is true, but R is false. D Option D A is false, but R is true.
Skip Check Show the explanation Hide the explanation Next question Try again
Show the explanation Hide the explanation Answer D · A is false, but R is true.
A is false: a falling MRS makes the curve convex, not concave.
R is true.
Read the two statements and choose the correct option.
I. The MRS is the slope of an indifference curve.
II. The MRS shows the rate at which the market exchanges the two goods.
Options for question 45 A Option A Only I B Option B Only II C Option C Both I and II D Option D Neither I nor II
Skip Check Show the explanation Hide the explanation Next question Try again
Show the explanation Hide the explanation Answer A · Only I
I is true.
II is false: the MRS is the consumer's own willingness to exchange; the market rate is the price ratio, the slope of the budget line.
Bundle P has 5 units of each good and bundle Q has 6 units of good 1 and 5 of good 2. With monotonic preferences,
Options for question 46 A Option A P and Q lie on the same indifference curve B Option B P is preferred to Q C Option C nothing can be said without prices D Option D Q is preferred to P, so Q lies on a higher indifference curve
Skip Check Show the explanation Hide the explanation Next question Try again
Show the explanation Hide the explanation Answer D · Q is preferred to P, so Q lies on a higher indifference curve
Q has more of good 1 and the same of good 2.
Monotonic preferences rank it higher, so it is on a higher indifference curve.
Which pair of bundles could lie on the same indifference curve, with monotonic preferences?
Options for question 47 A Option A (3, 7) and (4, 8) B Option B (3, 7) and (3, 9) C Option C (3, 7) and (2, 6) D Option D (3, 7) and (5, 4)
Skip Check Show the explanation Hide the explanation Next question Try again
Show the explanation Hide the explanation Answer D · (3, 7) and (5, 4)
Bundles on one curve must trade more of one good for less of the other.
(5, 4) has more of good 1 and less of good 2 than (3, 7). Each of the others has more of one and no less of the other (or less of both), so it is strictly better or worse.
Read the two statements and choose the correct option.
I. Each indifference curve shows a different level of satisfaction.
II. All bundles on one indifference curve cost the same.
Options for question 48 A Option A Only I B Option B Only II C Option C Both I and II D Option D Neither I nor II
Skip Check Show the explanation Hide the explanation Next question Try again
Show the explanation Hide the explanation Answer A · Only I
I is true: the map has one curve per level of satisfaction.
II is false: equal cost describes a budget line; bundles on one indifference curve can cost very different amounts.
Assertion (A): Indifference curves cannot intersect.
Reason (R): A higher indifference curve gives a higher level of satisfaction.
Options for question 49 A Option A Both A and R are true, and R is the correct explanation of A. B Option B Both A and R are true, but R is not the correct explanation of A. C Option C A is true, but R is false. D Option D A is false, but R is true.
Skip Check Show the explanation Hide the explanation Next question Try again
Show the explanation Hide the explanation Answer A · Both A and R are true, and R is the correct explanation of A.
Both are true.
If two curves crossed, the shared bundle would have to be on a higher and a lower level at once. Since higher curves mean more satisfaction (R), that is impossible: R explains A.
A consumer is indifferent between (4 apples, 10 bananas) and (6 apples, 7 bananas). What is his MRS of apples for bananas over this range?
Options for question 50 A Option A 3 bananas per apple B Option B 1.5 bananas per apple C Option C 2 bananas per apple D Option D 0.67 banana per apple
Skip Check Show the explanation Hide the explanation Next question Try again
Show the explanation Hide the explanation Answer B · 1.5 bananas per apple
He gives up 10 − 7 = 3 bananas for 6 − 4 = 2 more apples.
MRS = 3 ÷ 2 = 1.5 bananas per apple.
Worth noting
0.67 is apples per banana, the inverse.
A consumer always gives up 2 units of good 2 for 1 more unit of good 1, whatever he has. His indifference curves are
Options for question 51 A Option A convex curves with a falling MRS B Option B concave curves C Option C straight lines with a constant MRS of 2 D Option D vertical lines
Skip Check Show the explanation Hide the explanation Next question Try again
Show the explanation Hide the explanation Answer C · straight lines with a constant MRS of 2
A constant MRS means a constant slope: the indifference curve is a straight line.
This happens when the two goods are perfect substitutes for him.
The consumer's optimal choice 16 questions With indifference curves, a consumer is in equilibrium where
Options for question 52 A Option A the budget line cuts the lowest indifference curve B Option B the budget line just touches the highest indifference curve it can reach C Option C the indifference curve meets an axis D Option D the budget line meets an axis
Skip Check Show the explanation Hide the explanation Next question Try again
Show the explanation Hide the explanation Answer B · the budget line just touches the highest indifference curve it can reach
The consumer wants the highest satisfaction he can afford: the highest indifference curve that still has a point on the budget line.
That curve just touches the line: at the point of tangency, MRS = P₁ ÷ P₂.
At the consumer's optimum, which condition holds?
Options for question 53 A Option A MRS = 0 B Option B MRS = P₁ ÷ P₂ C Option C MRS = M ÷ P₁ D Option D P₁ = P₂
Skip Check Show the explanation Hide the explanation Next question Try again
Show the explanation Hide the explanation Answer B · MRS = P₁ ÷ P₂
At the tangency, the slope of the indifference curve (MRS) equals the slope of the budget line (P₁ ÷ P₂).
The rate at which the consumer is willing to swap equals the rate at which the market lets him swap.
In the graph, where is the consumer's optimum?
Options for question 54 A Option A At E, on IC₂, with 10 units of good 1 and 5 of good 2 B Option B On IC₃, because it gives the most satisfaction C Option C Where IC₁ cuts the budget line D Option D At 20 units of good 1 and none of good 2
Skip Check Show the explanation Hide the explanation Next question Try again
Show the explanation Hide the explanation Answer A · At E, on IC₂, with 10 units of good 1 and 5 of good 2
IC₃ lies wholly beyond the budget line, so it cannot be reached.
IC₁ can be reached but is lower. IC₂ is the highest curve the line touches, at E (10, 5).
In the graph, why will the consumer not choose a point where IC₁ cuts the budget line?
Options for question 55 A Option A Those points cost more than his income B Option B Those points give more satisfaction than E C Option C IC₁ is not convex D Option D Moving along the budget line towards E puts him on a higher indifference curve at the same cost
Skip Check Show the explanation Hide the explanation Next question Try again
Show the explanation Hide the explanation Answer D · Moving along the budget line towards E puts him on a higher indifference curve at the same cost
Where IC₁ cuts the line, the bundles are affordable, but the line continues inside better curves.
Spending the same income, he can reach IC₂ at E, so those points are not optimal.
Assertion (A): At the optimum, the consumer spends his whole income.
Reason (R): The optimum lies on the budget line.
Options for question 56 A Option A Both A and R are true, and R is the correct explanation of A. B Option B Both A and R are true, but R is not the correct explanation of A. C Option C A is true, but R is false. D Option D A is false, but R is true.
Skip Check Show the explanation Hide the explanation Next question Try again
Show the explanation Hide the explanation Answer A · Both A and R are true, and R is the correct explanation of A.
Both are true.
Every point on the budget line costs exactly M, so lying on it (R) is why the whole income is spent (A).
Read the two statements and choose the correct option.
I. At the optimum, the indifference curve and the budget line have the same slope.
II. At the optimum, the indifference curve is convex to the origin.
Options for question 57 A Option A Only I B Option B Only II C Option C Both I and II D Option D Neither I nor II
Skip Check Show the explanation Hide the explanation Next question Try again
Show the explanation Hide the explanation Answer C · Both I and II
I is the tangency condition, MRS = P₁ ÷ P₂: true.
II is true too: convexity is what makes the tangency point the best one, not just any touching point.
Match each item with what it measures or shows.
List I List II A. Slope of the budget line I. The most of good 1 the income can buy, M ÷ P₁ B. Slope of an indifference curve II. The price ratio P₁ ÷ P₂ C. Intercept of the budget line on the good-1 axis III. The consumer's optimum D. Point of tangency IV. The marginal rate of substitution
Options for question 58 A Option A A-II, B-I, C-III, D-IV B Option B A-I, B-II, C-IV, D-III C Option C A-II, B-IV, C-I, D-III D Option D A-IV, B-III, C-II, D-I
Skip Check Show the explanation Hide the explanation Next question Try again
Show the explanation Hide the explanation Answer C · A-II, B-IV, C-I, D-III
The budget line's slope is the market rate, P₁ ÷ P₂; the indifference curve's slope is the MRS.
The good-1 intercept is M ÷ P₁, and the tangency marks the optimum.
The ordinal approach to consumer's equilibrium differs from the cardinal approach because it
Options for question 59 A Option A only ranks bundles, without measuring utility in numbers B Option B measures utility in utils C Option C ignores prices D Option D ignores income
Skip Check Show the explanation Hide the explanation Next question Try again
Show the explanation Hide the explanation Answer A · only ranks bundles, without measuring utility in numbers
Indifference-curve analysis needs only to know which bundle is preferred, not by how many utils.
In the graph, which indifference curve is unattainable with the given income?
Options for question 60 A Option A IC₃ B Option B IC₂ C Option C IC₁ D Option D None of them
Skip Check Show the explanation Hide the explanation Next question Try again
Show the explanation Hide the explanation Answer A · IC₃
IC₃ lies wholly beyond the budget line: none of its bundles is affordable.
Assertion (A): If MRS is greater than P₁ ÷ P₂, the consumer gains by buying more of good 1.
Reason (R): He values one more unit of good 1 at more units of good 2 than the market charges.
Options for question 61 A Option A Both A and R are true, and R is the correct explanation of A. B Option B Both A and R are true, but R is not the correct explanation of A. C Option C A is true, but R is false. D Option D A is false, but R is true.
Skip Check Show the explanation Hide the explanation Next question Try again
Show the explanation Hide the explanation Answer A · Both A and R are true, and R is the correct explanation of A.
Both are true, and R explains A.
In the graph, check the tangency condition at E. P₁ = ₹5, P₂ = ₹10. What must the MRS be at E?
Options for question 62 A Option A 2 units of good 2 per unit of good 1 B Option B 5 units of good 2 per unit of good 1 C Option C 0.5 unit of good 2 per unit of good 1 D Option D 10 units of good 2 per unit of good 1
Skip Check Show the explanation Hide the explanation Next question Try again
Show the explanation Hide the explanation Answer C · 0.5 unit of good 2 per unit of good 1
At the optimum, MRS = P₁ ÷ P₂ = 5 ÷ 10 = 0.5.
This also equals the size of the budget line's slope: 10 ÷ 20.
P₁ = ₹4 and P₂ = ₹2. At a consumer's current bundle on the budget line, the MRS is 3. What should he do?
Options for question 63 A Option A Buy more of good 2 and less of good 1 B Option B Stay where he is C Option C Spend less of his income D Option D Buy more of good 1 and less of good 2
Skip Check Show the explanation Hide the explanation Next question Try again
Show the explanation Hide the explanation Answer D · Buy more of good 1 and less of good 2
He would give up 3 units of good 2 for one more unit of good 1, but the market asks only P₁ ÷ P₂ = 2.
So swapping good 2 for good 1 raises his satisfaction; as he does, his MRS falls towards 2.
P₁ = ₹6 and P₂ = ₹3. At a consumer's current bundle on the budget line, the MRS is 1. To reach the optimum he should
Options for question 64 A Option A buy more of good 1 and less of good 2 B Option B buy less of good 1 and more of good 2 C Option C stay where he is D Option D stop buying good 2
Skip Check Show the explanation Hide the explanation Next question Try again
Show the explanation Hide the explanation Answer B · buy less of good 1 and more of good 2
The market rate is P₁ ÷ P₂ = 2: one unit of good 1 costs 2 units of good 2.
He values a unit of good 1 at only 1 unit of good 2, less than it costs, so he should give up good 1 for good 2.
Assertion (A): A consumer can be at his optimum at a point inside the budget line.
Reason (R): With monotonic preferences, more is always better.
Options for question 65 A Option A Both A and R are true, and R is the correct explanation of A. B Option B Both A and R are true, but R is not the correct explanation of A. C Option C A is true, but R is false. D Option D A is false, but R is true.
Skip Check Show the explanation Hide the explanation Next question Try again
Show the explanation Hide the explanation Answer D · A is false, but R is true.
A is false: inside the line some income is unspent, and spending it on more goods raises satisfaction.
R is true, and is exactly why a point inside cannot be the optimum.
In the graph, the consumer's income rises and prices stay the same. The new optimum will most likely be
Options for question 66 A Option A still at E B Option B on a higher indifference curve, where a new, parallel budget line touches one C Option C on IC₁ D Option D at the good-2 intercept
Skip Check Show the explanation Hide the explanation Next question Try again
Show the explanation Hide the explanation Answer B · on a higher indifference curve, where a new, parallel budget line touches one
Higher income shifts the budget line out in parallel.
The consumer can now reach a higher indifference curve; the new optimum is where the new line touches the highest one it reaches.
P₁ = ₹2 and P₂ = ₹1, so the price ratio P₁ ÷ P₂ is 2. Match each MRS at the consumer's bundle with what he should do.
List I List II A. MRS = 3 I. Stay: he is at the optimum B. MRS = 2 II. Buy much less of good 1 C. MRS = 1 III. Buy more of good 1 D. MRS = 0.5 IV. Buy less of good 1
Options for question 67 A Option A A-III, B-IV, C-II, D-I B Option B A-IV, B-III, C-I, D-II C Option C A-II, B-I, C-IV, D-III D Option D A-III, B-I, C-IV, D-II
Skip Check Show the explanation Hide the explanation Back to start Try again
Show the explanation Hide the explanation Answer D · A-III, B-I, C-IV, D-II
MRS above 2: good 1 is worth more to him than it costs, so buy more. MRS = 2: tangency, the optimum.
MRS below 2: good 1 is worth less than it costs, so buy less; the further below, the larger the move.
Question types · easy to hard
NTA's Economics syllabus is three courses: Introductory Microeconomics, Introductory Macroeconomics and Indian Economic Development, each split into units with a list of topics. It prints no chapters and no split of the 50 questions across the courses. So the areas here are NTA's three courses, and the chapters inside them are ours: a unit that covers several ideas, such as consumer behaviour and demand, is split into a chapter for each, so that a chapter can be practised in one sitting. All three courses are here.