EduFarming
Your list · 0हिं

Type at least two letters. Press Esc to close.

↑↓ navigate↵ openTAB cycle filter

Demand and Its Determinants for CUET Economics

About 5 min to learn · 66 questions

What decides how much of a good people buy. This lesson covers the demand schedule and curve, the law of demand and why the curve slopes down, the other determinants of demand (income, prices of related goods, tastes, expectations, number of buyers), normal, inferior and Giffen goods, substitutes and complements, the difference between a movement along the curve and a shift of it, and market demand, with worked examples.

Syllabus area
Introductory Microeconomics
On this page · 9 sections
  1. 01The core idea
  2. 02The law of demand
  3. 03What else decides demand
  4. 04Movement and shift
  5. 05Market demand
  6. 06Exam shortcuts
  7. 07Common mistakes
  8. 08Quick revision
  9. 09Check your understanding

The core idea

Demand is the quantity buyers are willing and able to buy at each price. A wish without the money to pay is not demand. The single most tested idea in this chapter is the difference between a change in the good's own price, which moves buyers along the demand curve, and a change in anything else, which shifts the whole curve.

The law of demand

What does the law say?

Other things remaining the same, when the price of a good rises, the quantity demanded falls, and when the price falls, the quantity demanded rises. The demand curve slopes downward.

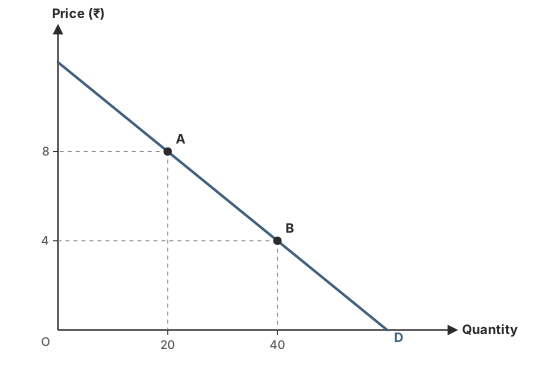
A demand curve D, Qd = 60 − 5P: point A at ₹8 and 20 units, point B at ₹4 and 40 units.
A fall in price from ₹8 to ₹4 moves the buyer from A to B along the same curve.

Why does the demand curve slope downward?

  • Substitution effect: a cheaper good becomes cheaper relative to its substitutes, so buyers switch to it.
  • Income effect: a lower price raises real income (what the same money buys), so more can be bought.
  • Diminishing marginal utility: each extra unit is worth less, so buyers take more only at a lower price.

Example 1 · Reading a demand function

Qd = 60 − 5P. Find the quantity at ₹10 and the price at which nothing is demanded.

  1. At P = 10: 60 − 50 = 10 units.

  2. Qd = 0 when 60 − 5P = 0, so P = ₹12.

Answer

10 units at ₹10; demand is zero at ₹12

Exceptions: a Giffen good, an inferior staple of very poor households whose quantity demanded can rise when its price rises, and goods bought as status symbols.

What else decides demand

Which factors shift the demand curve?

DeterminantEffect on demand
Income risesNormal good: increases. Inferior good: decreases
Price of a substitute risesIncreases (tea dearer, more coffee)
Price of a complement risesDecreases (petrol dearer, fewer cars)
Tastes move in favourIncreases
Price expected to riseIncreases today
More buyersMarket demand increases

A normal good is one whose demand rises with income; an inferior good one whose demand falls with income, such as coarse grain for a family that can now afford better. Substitutes can replace each other; complements are used together.

Watch out

Every Giffen good is inferior, but most inferior goods are not Giffen goods: they still obey the law of demand.

Movement and shift

How are they different?

TermCaused byShown as
Extension of demandFall in own priceMovement down the curve
Contraction of demandRise in own priceMovement up the curve
Increase in demandAny other factor, favourablyShift to the right
Decrease in demandAny other factor, unfavourablyShift to the left
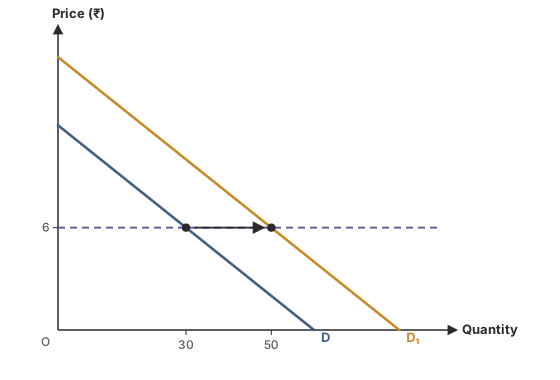
Two demand curves, D (Qd = 60 − 5P) and D₁ (Qd = 80 − 5P). At ₹6, D gives 30 units and D₁ gives 50.
An increase in demand: 20 more units at the same price of ₹6.

Watch out

"A fall in price increases demand" is wrong. A fall in own price extends demand along the curve; only other factors increase demand.

Market demand

How is market demand found?

Add the quantities every buyer demands at each price. On a graph, this is the horizontal sum of the individual demand curves.

Example 2 · Adding two buyers

q₁ = 20 − 2P and q₂ = 30 − 3P. Find market demand and its value at ₹4.

  1. Add at each price: (20 − 2P) + (30 − 3P) = 50 − 5P.

  2. At P = 4: 50 − 20 = 30 (q₁ = 12, q₂ = 18).

Answer

Q = 50 − 5P; 30 units at ₹4

More buyers, or income moved towards buyers of a good, shift market demand to the right even if no single buyer's demand changes.

Exam shortcuts

  • Own price: along the curve. Anything else: shift.
  • Substitute dearer, demand up; complement dearer, demand down.
  • Income up: normal goods up, inferior goods down.

Common mistakes

  • Calling a movement along the curve an increase or decrease in demand.
  • Treating every inferior good as a Giffen good.
  • Averaging individual demands instead of adding them.

Quick revision

Law of demand

  • Price up, quantity demanded down
  • Substitution effect, income effect, diminishing MU
  • Exceptions: Giffen and status goods

Shifters

  • Income, related goods, tastes, expectations, buyers
  • Normal vs inferior; substitutes vs complements

Terms

  • Extension and contraction: along the curve
  • Increase and decrease: shifts

How strongly quantity reacts to price is measured in price elasticity of demand.

Next · 08Quick revision

Check your understanding

66 questions, grouped by type, easy to hard. Pick an answer and check it. The worked solution opens when you ask for it.

The demand schedule, curve and lawQ1 of 66Q1

The demand schedule, curve and law

15 questions

The law of demand states that, other things remaining the same,

Options for question 1

Show the explanationHide the explanation

AnswerB · the quantity demanded of a good falls when its price rises

  1. Price and quantity demanded move in opposite directions, other factors held constant.

A demand schedule is

Options for question 2

Show the explanationHide the explanation

AnswerD · a table showing the quantities of a good demanded at different prices

  1. It pairs each price with the quantity buyers would demand at it; drawn as a graph, it is the demand curve.

A demand curve is drawn with price on the vertical axis. It usually

Options for question 3

Show the explanationHide the explanation

AnswerA · slopes downward from left to right

  1. Lower prices go with larger quantities demanded, so the curve falls to the right.

In the graph, the price falls from ₹8 to ₹4. What happens?

A demand curve D, Qd = 60 − 5P: point A at price ₹8 and quantity 20, point B at price ₹4 and quantity 40.
Options for question 4

Show the explanationHide the explanation

AnswerA · Quantity demanded rises from 20 to 40: a movement down the curve from A to B

  1. A change in the good's own price moves the buyer along the same curve.

  2. At ₹8 the quantity is 20 (A); at ₹4 it is 40 (B). This is an extension of demand.

Worth noting

'Demand increases' means the whole curve moves right, which a change in own price does not cause.

In the graph, the demand curve is Qd = 60 − 5P. What quantity is demanded at a price of ₹10?

A demand curve D, Qd = 60 − 5P: point A at price ₹8 and quantity 20, point B at price ₹4 and quantity 40.
Options for question 5

Show the explanationHide the explanation

AnswerB · 10

  1. Qd = 60 − 5 × 10 = 60 − 50 = 10.

For the demand function Qd = 60 − 5P, at what price is nothing demanded?

Options for question 6

Show the explanationHide the explanation

AnswerC · ₹12

  1. Set Qd = 0: 60 − 5P = 0, so P = 12.

  2. This is where the demand curve meets the price axis.

Worth noting

At ₹0, the quantity is 60, the most demanded.

Which of these is a reason the demand curve slopes downward?

Options for question 7

Show the explanationHide the explanation

AnswerC · When a good becomes cheaper, buyers switch to it from its substitutes

  1. A lower price makes the good cheaper relative to its substitutes, so buyers substitute towards it: the substitution effect.

  2. A lower price also raises real income (income effect) and, with diminishing MU, a lower price justifies more units.

Worth noting

Sellers supplying more is the law of supply, not a reason for the demand curve's slope.

When the price of a good falls, the consumer can buy the same quantity and still have money left. This is called

Options for question 8

Show the explanationHide the explanation

AnswerB · the income effect

  1. A lower price raises the consumer's real income, his purchasing power, which lets him buy more.

Assertion (A): A demand curve slopes downward from left to right.

Reason (R): Price and quantity demanded are inversely related, other things being equal.

Options for question 9

Show the explanationHide the explanation

AnswerA · Both A and R are true, and R is the correct explanation of A.

  1. Both are true.

  2. The inverse relation (the law of demand) is exactly what a downward slope draws, so R explains A.

Read the two statements and choose the correct option.

I. The law of demand holds only when other things such as income and tastes stay the same.

II. The law of demand describes how quantity demanded changes with income.

Options for question 10

Show the explanationHide the explanation

AnswerA · Only I

  1. I is true: 'other things being equal' is part of the law.

  2. II is false: the law relates quantity to the good's own price, not to income.

A demand schedule is given.

Price (₹)54321
Quantity demanded1015202530

Which equation describes it?

Options for question 11

Show the explanationHide the explanation

AnswerD · Qd = 35 − 5P

  1. Each ₹1 fall in price raises quantity by 5, so the coefficient of P is −5.

  2. At P = 5, Q = 10: 10 = a − 25, so a = 35. Check at P = 1: 35 − 5 = 30.

Which of these is an exception to the law of demand?

Options for question 12

Show the explanationHide the explanation

AnswerD · Goods bought as status symbols, whose demand rises with price

  1. Some buyers want a good because it is expensive, so a higher price can raise the quantity they demand.

  2. Salt still obeys the law, though its demand is inelastic.

Read the two statements and choose the correct option.

I. Quantity demanded is the amount buyers are willing and able to buy at a given price.

II. Demand means the desire for a good, whether or not the buyer can pay.

Options for question 13

Show the explanationHide the explanation

AnswerA · Only I

  1. I is true: willingness and ability together make demand.

  2. II is false: a desire without the means to pay is not demand in economics.

A demand schedule is given.

Price (₹)54321
Quantity demanded1015202530

What is the total spending by buyers at a price of ₹3?

Options for question 14

Show the explanationHide the explanation

AnswerD · ₹60

  1. At ₹3, quantity demanded is 20.

  2. Total spending = price × quantity = ₹3 × 20 = ₹60.

Assertion (A): When the price of a good falls, a consumer buys more of it partly because his real income rises.

Reason (R): A fall in price raises the consumer's money income.

Options for question 15

Show the explanationHide the explanation

AnswerC · A is true, but R is false.

  1. A is the income effect, which is true for a normal good.

  2. R is false: money income is unchanged; it is real income, what the money can buy, that rises.

Determinants of demand

16 questions

Which of these is NOT a determinant of the demand for a good?

Options for question 16

Show the explanationHide the explanation

AnswerC · The cost of producing the good

  1. Demand depends on things on the buyer's side: own price, income, prices of related goods, tastes and expectations.

  2. The cost of production is a determinant of supply.

A rise in the price of a good changes

Options for question 17

Show the explanationHide the explanation

AnswerA · the quantity demanded, a movement along the demand curve

  1. The good's own price is on the axis of the demand curve; changing it moves the buyer along the curve.

News that a fruit is good for health makes people buy more of it at every price. Its demand curve

Options for question 18

Show the explanationHide the explanation

AnswerD · shifts to the right

  1. A favourable change in tastes raises the quantity demanded at each price.

  2. More at every price means the whole curve moves right: an increase in demand.

People expect the price of a smartphone to rise next month. Today's demand for smartphones

Options for question 19

Show the explanationHide the explanation

AnswerC · rises

  1. Buyers bring purchases forward to beat the expected price rise.

  2. So demand today rises: the curve shifts right.

A town's population grows. Other things the same, the market demand for bread

Options for question 20

Show the explanationHide the explanation

AnswerA · increases: the market demand curve shifts right

  1. Market demand adds up all buyers; more buyers mean more demanded at each price.

The demand curve moves from D to D₁ as shown. Which event could cause this for a normal good?

Two demand curves: D (Qd = 60 − 5P) and D₁ (Qd = 80 − 5P), to its right. At a price of ₹6, the quantity on D is 30 and on D₁ is 50. An arrow points from D to D₁ at that price.
Options for question 21

Show the explanationHide the explanation

AnswerB · A rise in consumers' income

  1. At ₹6, demand rises from 30 to 50: more is demanded at the same price, so demand has increased.

  2. For a normal good, a rise in income does this. A cheaper substitute or a dearer complement would shift it left.

Worth noting

A fall in the good's own price is a movement along D, not a shift to D₁.

In the graph, by how much does demand change at a price of ₹6 when the curve moves from D to D₁?

Two demand curves: D (Qd = 60 − 5P) and D₁ (Qd = 80 − 5P), to its right. At a price of ₹6, the quantity on D is 30 and on D₁ is 50. An arrow points from D to D₁ at that price.
Options for question 22

Show the explanationHide the explanation

AnswerD · It rises by 20 units

  1. On D at ₹6: 60 − 5 × 6 = 30. On D₁ at ₹6: 80 − 5 × 6 = 50.

  2. The rise is 50 − 30 = 20 units at the same price.

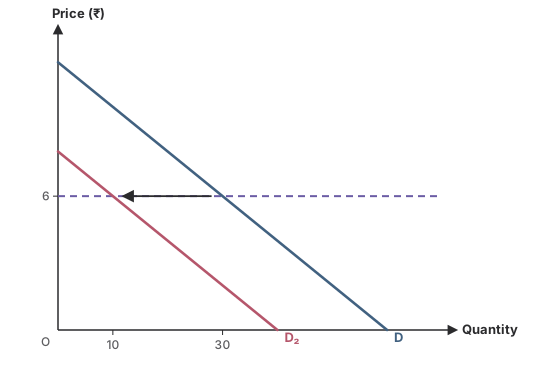
The demand curve moves from D to D₂ as shown. This is called

Two demand curves: D (Qd = 60 − 5P) and D₂ (Qd = 40 − 5P), to its left. At a price of ₹6, the quantity on D is 30 and on D₂ is 10. An arrow points from D to D₂.
Options for question 23

Show the explanationHide the explanation

AnswerA · a decrease in demand

  1. At the same price of ₹6, buyers now want 10 instead of 30: less at each price.

  2. A leftward shift of the whole curve is a decrease in demand.

Worth noting

A contraction is a movement up the same curve caused by a rise in own price.

Assertion (A): A fall in the price of tea shifts the demand curve for coffee to the left.

Reason (R): Tea and coffee are substitutes.

Options for question 24

Show the explanationHide the explanation

AnswerA · Both A and R are true, and R is the correct explanation of A.

  1. Both are true.

  2. Because they are substitutes (R), cheaper tea draws buyers away from coffee, lowering coffee's demand at each price (A).

Which change would shift the demand curve for ice cream to the right?

Options for question 25

Show the explanationHide the explanation

AnswerB · A very hot summer

  1. Weather changes tastes for the season: more ice cream is wanted at every price.

  2. Own-price changes move along the curve; lower income shifts a normal good's curve left.

Read the two statements and choose the correct option.

I. A rise in the price of a complement shifts a good's demand curve to the right.

II. A rise in the price of a substitute shifts a good's demand curve to the right.

Options for question 26

Show the explanationHide the explanation

AnswerB · Only II

  1. I is false: a dearer complement makes using the pair costlier, so demand falls (left).

  2. II is true: a dearer substitute sends buyers to this good (right).

A health scare about a food product lowers what people want to buy at every price. Its demand curve

Options for question 27

Show the explanationHide the explanation

AnswerC · shifts to the left

  1. An unfavourable change in tastes lowers demand at each price: a leftward shift.

Assertion (A): An expected fall in the price of a good next month lowers its demand today.

Reason (R): Buyers postpone purchases they expect to get cheaper later.

Options for question 28

Show the explanationHide the explanation

AnswerA · Both A and R are true, and R is the correct explanation of A.

  1. Both are true, and R explains A.

Read the two statements and choose the correct option.

I. A change in the price of a good shifts its own demand curve.

II. A change in the price of a related good shifts a good's demand curve.

Options for question 29

Show the explanationHide the explanation

AnswerB · Only II

  1. I is false: own price moves the buyer along the curve.

  2. II is true: related goods' prices are among the 'other things' whose change shifts the curve.

The government gives every household a cash transfer of ₹2,000 a month. What happens to the demand for an inferior good?

Options for question 30

Show the explanationHide the explanation

AnswerC · It decreases: the demand curve shifts left

  1. The transfer raises households' income.

  2. Demand for an inferior good falls as income rises, so its curve shifts left.

Demand for a good is Qd = 50 − 2P + 0.1Y, where Y is income. If income rises from ₹200 to ₹300, at a price of ₹10 the quantity demanded

Options for question 31

Show the explanationHide the explanation

AnswerB · rises from 50 to 60

  1. At Y = 200: 50 − 20 + 20 = 50. At Y = 300: 50 − 20 + 30 = 60.

  2. Demand rises with income, so this is a normal good and its curve shifts right.

15 questions

A normal good is one whose demand

Options for question 32

Show the explanationHide the explanation

AnswerD · rises when the consumer's income rises

  1. For a normal good, income and demand move in the same direction.

An inferior good is one whose demand

Options for question 33

Show the explanationHide the explanation

AnswerB · falls when the consumer's income rises

  1. As income rises, buyers switch from an inferior good to a better one, so its demand falls.

  2. Coarse grains for a household that can now afford better grains are a common example.

Two goods used together, such as a car and petrol, are

Options for question 34

Show the explanationHide the explanation

AnswerC · complements

  1. Complements are consumed together, so a rise in the price of one lowers the demand for the other.

When a family's income rises, it buys less coarse grain and more fine rice. For this family, coarse grain is

Options for question 35

Show the explanationHide the explanation

AnswerC · an inferior good

  1. Its demand falls as income rises, which defines an inferior good.

  2. Fine rice, whose demand rises with income, is a normal good for the family.

The price of petrol rises sharply. Other things the same, the demand for cars

Options for question 36

Show the explanationHide the explanation

AnswerB · falls: the demand curve for cars shifts left

  1. Cars and petrol are complements: running a car now costs more.

  2. So fewer cars are demanded at each car price: a leftward shift.

If a rise in the price of good Y raises the demand for good X, then X and Y are

Options for question 37

Show the explanationHide the explanation

AnswerD · substitutes

  1. Dearer Y sends buyers to X, which can take its place: they are substitutes.

Which pair of goods are most likely complements?

Options for question 38

Show the explanationHide the explanation

AnswerA · Pen and ink

  1. A pen needs ink: they are used together.

  2. The other pairs can each be used in place of the other: substitutes.

Assertion (A): A rise in income shifts the demand curve for an inferior good to the left.

Reason (R): Demand for an inferior good falls as income rises.

Options for question 39

Show the explanationHide the explanation

AnswerA · Both A and R are true, and R is the correct explanation of A.

  1. Both are true, and R is the definition that makes A follow.

Read the two statements and choose the correct option.

I. Whether a good is normal or inferior can differ from one consumer to another.

II. A good that is normal at low incomes can become inferior at high incomes.

Options for question 40

Show the explanationHide the explanation

AnswerC · Both I and II

  1. Both are true: the label depends on how a particular buyer's demand responds to his income.

  2. A poor household may buy more coarse grain as income first rises, then less once it can afford better food.

Match each change with its effect on the demand for tea, a normal good.

List IList II
A. Consumers' income risesI. Demand for tea decreases (complement dearer)
B. The price of coffee fallsII. Demand for tea increases
C. The price of sugar risesIII. Quantity demanded of tea rises
D. The price of tea fallsIV. Demand for tea decreases (substitute cheaper)
Options for question 41

Show the explanationHide the explanation

AnswerA · A-II, B-IV, C-I, D-III

  1. Higher income raises demand for a normal good; cheaper coffee, a substitute, lowers it.

  2. Dearer sugar, a complement, lowers it; tea's own price fall is a movement along the curve.

The price of printers falls sharply. Other things the same, the demand for printer ink

Options for question 42

Show the explanationHide the explanation

AnswerC · increases

  1. Printers and ink are complements: cheaper printers mean more printers in use.

  2. So more ink is demanded at every ink price: an increase in demand.

Train fares are cut. Other things the same, the demand for bus travel between the same cities

Options for question 43

Show the explanationHide the explanation

AnswerA · decreases

  1. Train and bus travel are substitutes: cheaper trains draw travellers away from buses.

A Giffen good is

Options for question 44

Show the explanationHide the explanation

AnswerD · an inferior good whose quantity demanded rises when its price rises

  1. For a very poor household spending much of its income on a staple, a price rise can cut real income so much that it buys more of the staple and less of costlier food.

  2. This is an exception to the law of demand; such goods are always inferior goods.

Worth noting

Goods bought for show are a different exception, sometimes called Veblen goods.

Assertion (A): Every inferior good is a Giffen good.

Reason (R): Every Giffen good is an inferior good.

Options for question 45

Show the explanationHide the explanation

AnswerD · A is false, but R is true.

  1. A is false: most inferior goods still obey the law of demand; only an extreme few are Giffen goods.

  2. R is true: a Giffen good must be inferior.

Read the two statements and choose the correct option.

I. For substitutes, the price of one and the demand for the other move in the same direction.

II. For complements, the price of one and the demand for the other move in the same direction.

Options for question 46

Show the explanationHide the explanation

AnswerA · Only I

  1. I is true: dearer tea, more coffee demanded.

  2. II is false: dearer petrol, fewer cars demanded; they move in opposite directions.

Movement along and shift of the curve

10 questions

An extension of demand means

Options for question 47

Show the explanationHide the explanation

AnswerC · more is bought because the good's own price has fallen

  1. Extension is a movement down the demand curve caused by a fall in own price.

  2. More at the same price is an increase in demand, a shift.

A contraction of demand is caused by

Options for question 48

Show the explanationHide the explanation

AnswerB · a rise in the good's own price

  1. Contraction is a movement up the same demand curve, which only a rise in own price causes.

  2. The other changes shift the curve (a decrease in demand).

Which of these causes a decrease in demand rather than a contraction?

Options for question 49

Show the explanationHide the explanation

AnswerB · A fall in the price of a substitute

  1. A decrease in demand is a leftward shift caused by a factor other than own price.

  2. A cheaper substitute is such a factor; own-price changes cause contractions or extensions.

Read the two statements and choose the correct option.

I. A movement along a demand curve is caused by a change in the good's own price.

II. A shift of a demand curve is caused by a change in the good's own price.

Options for question 50

Show the explanationHide the explanation

AnswerA · Only I

  1. I is true; II is false: a shift comes from income, related goods' prices, tastes, expectations or the number of buyers.

Assertion (A): An increase in demand means more is demanded at every price.

Reason (R): An increase in demand is shown by a movement down the demand curve.

Options for question 51

Show the explanationHide the explanation

AnswerC · A is true, but R is false.

  1. A is true.

  2. R is false: more at every price is a rightward shift of the curve; a movement down it is an extension.

Match each term with what it shows on a graph.

List IList II
A. Extension of demandI. Movement up the same curve
B. Contraction of demandII. Shift of the curve to the left
C. Increase in demandIII. Movement down the same curve
D. Decrease in demandIV. Shift of the curve to the right
Options for question 52

Show the explanationHide the explanation

AnswerA · A-III, B-I, C-IV, D-II

  1. Extension and contraction are movements along one curve, down and up.

  2. Increase and decrease are shifts of the whole curve, right and left.

The price of mangoes rises and, at the same time, buyers' incomes rise. If the quantity of mangoes bought stays the same, the most likely explanation is

Options for question 53

Show the explanationHide the explanation

AnswerA · the increase in demand from income offset the contraction from the price rise

  1. The price rise moves buyers up the curve (less); the income rise shifts the curve right (more).

  2. If the two pulls are equal, the quantity bought can stay where it was.

Which pair is correctly matched?

Options for question 54

Show the explanationHide the explanation

AnswerD · Rise in own price — contraction of demand

  1. A rise in own price moves buyers up the curve: contraction.

  2. Higher income raises a normal good's demand (increase); a cheaper substitute lowers it (decrease); own-price fall is an extension.

A demand curve shifts from Qd = 60 − 5P to Qd = 60 − 5P + 10. At a price of ₹8, the quantity demanded

Options for question 55

Show the explanationHide the explanation

AnswerB · rises from 20 to 30

  1. Before: 60 − 40 = 20. After: 60 − 40 + 10 = 30.

  2. Ten more units at the same price: an increase in demand.

Assertion (A): A change in tastes causes a movement along the demand curve.

Reason (R): A demand curve is drawn with tastes held constant.

Options for question 56

Show the explanationHide the explanation

AnswerD · A is false, but R is true.

  1. A is false: since tastes are held constant along the curve, a change in them shifts the whole curve.

  2. R is true.

Market demand

10 questions

Market demand for a good is

Options for question 57

Show the explanationHide the explanation

AnswerD · the sum of the quantities demanded by all buyers at each price

  1. At each price, add up what every buyer wants: that is the market quantity demanded.

  2. On a graph this is the horizontal sum of the individual demand curves.

A market has three buyers. The table shows how many kilograms of apples each demands per week.

Price (₹)AnuRaviSara
10231
8452
6674
4896

What is the market demand at a price of ₹8?

Options for question 58

Show the explanationHide the explanation

AnswerC · 11 kg

  1. At ₹8: Anu 4 + Ravi 5 + Sara 2 = 11 kg.

A market has three buyers. The table shows how many kilograms of apples each demands per week.

Price (₹)AnuRaviSara
10231
8452
6674
4896

By how much does market demand rise when the price falls from ₹10 to ₹6?

Options for question 59

Show the explanationHide the explanation

AnswerC · 11 kg

  1. At ₹10: 2 + 3 + 1 = 6 kg. At ₹6: 6 + 7 + 4 = 17 kg.

  2. The rise is 17 − 6 = 11 kg.

Two buyers have demand functions q₁ = 20 − 2P and q₂ = 30 − 3P. What is the market demand function?

Options for question 60

Show the explanationHide the explanation

AnswerC · Q = 50 − 5P

  1. Add the quantities at each price: (20 − 2P) + (30 − 3P) = 50 − 5P.

  2. Both buyers demand something only up to P = 10, so the sum holds for prices from 0 to 10.

Worth noting

25 − 2.5P is the average of the two, not their sum.

Assertion (A): The market demand curve is obtained by adding individual demand curves horizontally.

Reason (R): At each price, market quantity demanded is the sum of individual quantities demanded.

Options for question 61

Show the explanationHide the explanation

AnswerA · Both A and R are true, and R is the correct explanation of A.

  1. Both are true.

  2. Adding quantities at a given price means adding along the horizontal (quantity) axis, so R explains A.

A market has three buyers. The table shows how many kilograms of apples each demands per week.

Price (₹)AnuRaviSara
10231
8452
6674
4896

What is the market demand at a price of ₹10?

Options for question 62

Show the explanationHide the explanation

AnswerC · 6 kg

  1. At ₹10: 2 + 3 + 1 = 6 kg.

A market has three buyers. The table shows how many kilograms of apples each demands per week.

Price (₹)AnuRaviSara
10231
8452
6674
4896

A fourth buyer enters who demands 3 kg at every price. What is the new market demand at ₹4?

Options for question 63

Show the explanationHide the explanation

AnswerC · 26 kg

  1. Before the new buyer, at ₹4: 8 + 9 + 6 = 23 kg.

  2. Adding 3 kg: 26 kg. More buyers shift the market demand curve to the right.

Using q₁ = 20 − 2P and q₂ = 30 − 3P, what is market demand at P = 4?

Options for question 64

Show the explanationHide the explanation

AnswerC · 30

  1. q₁ = 20 − 8 = 12; q₂ = 30 − 12 = 18.

  2. Market demand = 12 + 18 = 30. Check: 50 − 5 × 4 = 30.

Read the two statements and choose the correct option.

I. Market demand can rise even if no buyer's own demand changes.

II. Market demand depends on how income is distributed among buyers.

Options for question 65

Show the explanationHide the explanation

AnswerC · Both I and II

  1. I is true: new buyers entering raise the total.

  2. II is true: moving income from one group to another changes which goods are demanded and how much.

A market has three buyers. The table shows how many kilograms of apples each demands per week.

Price (₹)AnuRaviSara
10231
8452
6674
4896

Sara stops buying apples altogether. What is the market demand at ₹6?

Options for question 66

Show the explanationHide the explanation

AnswerC · 13 kg

  1. Without Sara: Anu 6 + Ravi 7 = 13 kg at ₹6.

  2. Fewer buyers shift the market demand curve to the left.

NTA's Economics syllabus is three courses: Introductory Microeconomics, Introductory Macroeconomics and Indian Economic Development, each split into units with a list of topics. It prints no chapters and no split of the 50 questions across the courses. So the areas here are NTA's three courses, and the chapters inside them are ours: a unit that covers several ideas, such as consumer behaviour and demand, is split into a chapter for each, so that a chapter can be practised in one sitting. All three courses are here.