EduFarming
Your list · 0हिं

Type at least two letters. Press Esc to close.

↑↓ navigate↵ openTAB cycle filter

Demand & Its Determinants · Question 5 of 66

In the graph, the demand curve is Qd = 60 − 5P.

Question 5

MediumOriginal question

In the graph, the demand curve is Qd = 60 − 5P. What quantity is demanded at a price of ₹10?
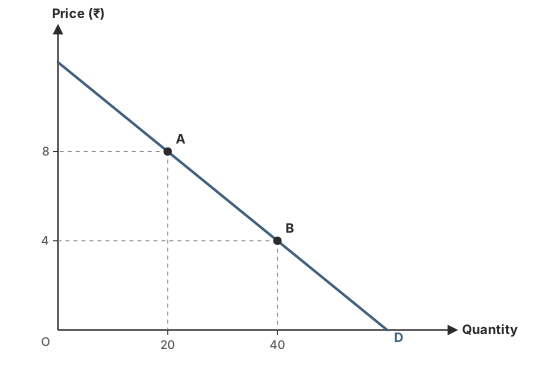
A demand curve D, Qd = 60 − 5P: point A at price ₹8 and quantity 20, point B at price ₹4 and quantity 40.
Options for question 5

Show the answer and explanation
CorrectNot quiteAnswer B

Correct answer: B

Explanation

  1. Qd = 60 − 5 × 10 = 60 − 50 = 10.

Concept
Reading a demand function
Typical time
70 s
Your time
—
The rule this testsThe demand schedule, curve and law
Practise this chapter →

Ten questions from Demand & Its Determinants, at your own pace.

Practise this chapter →

Ten questions from Demand & Its Determinants, at your own pace.