Question 40
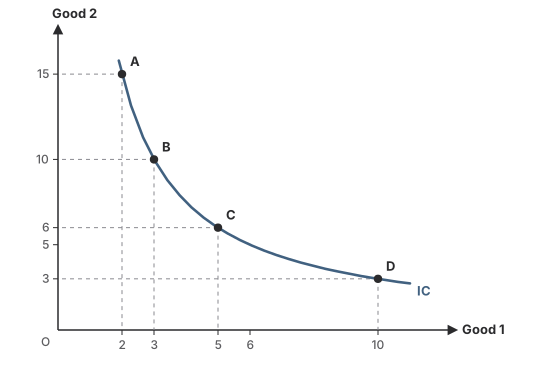
MediumOriginal questionIn the graph, the MRS falls from 5 (A to B) to 2 (B to C) and then to 0.6 (C to D). This shows that
Show the answer and explanation
CorrectNot quiteAnswer B
Correct answer: B
Explanation
Moving down the curve the consumer has more good 1 and less good 2, so he will part with less good 2 for each further unit of good 1.
C to D: good 2 falls by 3 while good 1 rises by 5, so MRS = 3 ÷ 5 = 0.6.
- Concept
- Why the MRS diminishes
- Typical timeTypical
- 70 s
- Your timeYours
- —
Practise this chapter →
Ten questions from Budget Line & Optimal Choice, at your own pace.