EduFarming
Your list · 0हिं

Type at least two letters. Press Esc to close.

↑↓ navigate↵ openTAB cycle filter

Cost Curves · Question 7 of 62

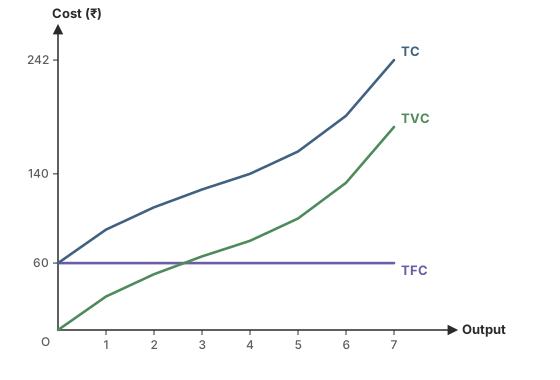
In the graph, the TC curve and the TVC curve
Question 7

MediumOriginal question

In the graph, the TC curve and the TVC curve

TFC is a horizontal line at ₹60. TVC starts at 0 and rises: 30, 50, 66, 80, 100, 132, 182 for 1 to 7 units. TC starts at ₹60 and runs ₹60 above TVC at every output, reaching ₹242 at 7 units.
Options for question 7

Show the answer and explanation
CorrectNot quiteAnswer C

Correct answer: C

Explanation

  1. TC = TVC + TFC, and TFC is the same ₹60 at every output.

  2. So the vertical gap between them never changes: the curves are parallel.

Concept
TC and TVC
Typical time
70 s
Your time
—
The rule this testsFixed and variable cost
Practise this chapter →

Ten questions from Cost Curves, at your own pace.

Practise this chapter →

Ten questions from Cost Curves, at your own pace.