EduFarming
Your list · 0हिं

Type at least two letters. Press Esc to close.

↑↓ navigate↵ openTAB cycle filter

Cost Curves · Question 47 of 62

The graph shows the usual short-run cost curves.

Question 47

MediumOriginal question

The graph shows the usual short-run cost curves. As output rises, in what order are the minimum points of MC, AVC and AC reached?
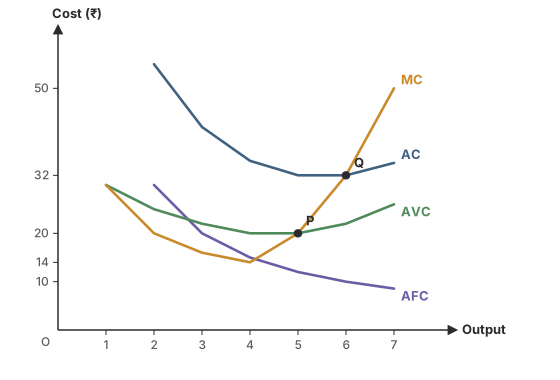
Short-run cost curves from the schedule. MC is 30, 20, 16, 14, 20, 32, 50 for the 1st to 7th unit, lowest at 14 for the 4th. AVC is 30, 25, 22, 20, 20, 22, 26, lowest at 20 for 4 and 5 units. AC (from 2 units) is 55, 42, 35, 32, 32, 34.57, lowest at 32 for 5 and 6 units. AFC falls from 30 at 2 units to 8.57 at 7. MC meets AVC at P (5 units, ₹20) and AC at Q (6 units, ₹32).
Options for question 47

Show the answer and explanation
CorrectNot quiteAnswer B

Correct answer: B

Explanation

  1. MC turns up first. AVC keeps falling until rising MC reaches it, and AC until MC reaches it.

Concept
Order of the minimum points
Typical time
70 s
Your time
—
The rule this testsThe shapes of the cost curves
Practise this chapter →

Ten questions from Cost Curves, at your own pace.

Practise this chapter →

Ten questions from Cost Curves, at your own pace.