EduFarming
Your list · 0हिं

Type at least two letters. Press Esc to close.

↑↓ navigate↵ openTAB cycle filter

Employment: Formal & Informal Work · Question 33 of 58

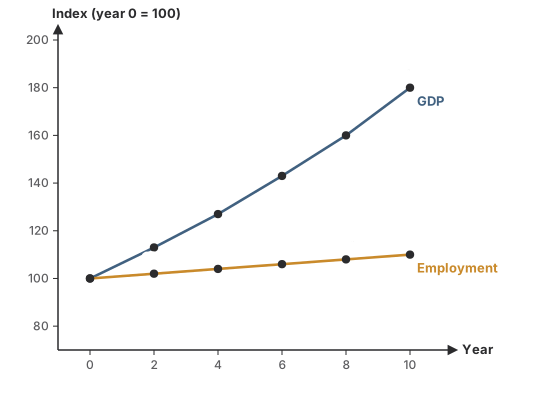
Using the graph shown, by how many index points did GDP rise between year 4 and year 8?
Question 33

HardOriginal question

Using the graph shown, by how many index points did GDP rise between year 4 and year 8?

A line graph of an economy's GDP and employment as indices, year 0 = 100. GDP: 100, 113, 127, 143, 160, 180 in years 0, 2, 4, 6, 8, 10. Employment: 100, 102, 104, 106, 108, 110.
Options for question 33

Show the answer and explanation
CorrectNot quiteAnswer C

Correct answer: C

Explanation

  1. GDP: 160 − 127 = 33 points.

  2. Over the same years, employment rose by 108 − 104 = 4.

Worth noting

4 is employment's rise; 27 is GDP's rise from year 0 to year 4.

Concept
Reading an index
Typical time
100 s
Your time
—
The rule this testsJobless growth and casualisation
Practise this chapter →

Ten questions from Employment: Formal & Informal Work, at your own pace.

Practise this chapter →

Ten questions from Employment: Formal & Informal Work, at your own pace.