EduFarming
Your list · 0हिं

Type at least two letters. Press Esc to close.

↑↓ navigate↵ openTAB cycle filter

Environment & Sustainable Development · Question 11 of 52

The graph shows a forest's yearly regrowth and yearly felling.

Question 11

HardOriginal question

The graph shows a forest's yearly regrowth and yearly felling. In which years is the forest being used within its carrying capacity?
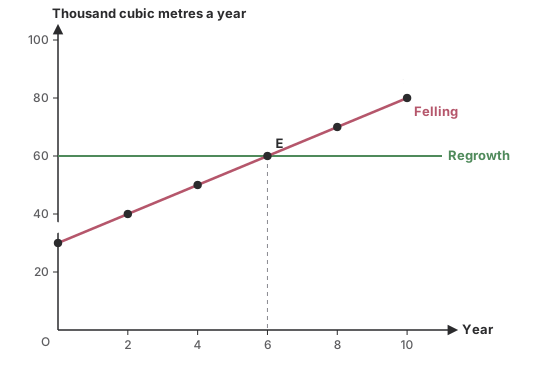
A graph of a forest's yearly regrowth and yearly felling, in thousand cubic metres. Regrowth is a flat line at 60. Felling rises in a straight line: 30 in year 0, 40 in year 2, 50 in year 4, 60 in year 6, 70 in year 8 and 80 in year 10. The two meet at point E, in year 6.
Options for question 11

Show the answer and explanation
CorrectNot quiteAnswer A

Correct answer: A

Explanation

  1. Up to year 6, felling (30 rising to 60) is at or below regrowth (60), so the forest stock does not shrink.

  2. After year 6, felling exceeds regrowth and the forest is being used up.

Concept
Carrying capacity
Typical time
100 s
Your time
—
The rule this testsThe environment and its functions
Practise this chapter →

Ten questions from Environment & Sustainable Development, at your own pace.

Practise this chapter →

Ten questions from Environment & Sustainable Development, at your own pace.