EduFarming
Your list · 0हिं

Type at least two letters. Press Esc to close.

↑↓ navigate↵ openTAB cycle filter

Environment & Sustainable Development · Question 19 of 52

The graph shows the amount of carbon dioxide in the air from 1960 to 2020.

Question 19

MediumOriginal question

The graph shows the amount of carbon dioxide in the air from 1960 to 2020. By how much did it rise over the whole period?
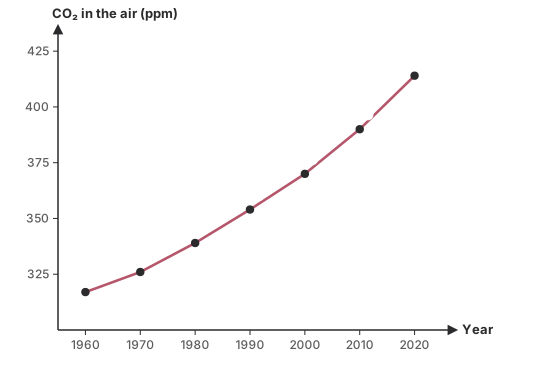
A line graph of carbon dioxide in the air at Mauna Loa, in parts per million: 317 in 1960, 326 in 1970, 339 in 1980, 354 in 1990, 370 in 2000, 390 in 2010 and 414 in 2020.
Options for question 19

Show the answer and explanation
CorrectNot quiteAnswer C

Correct answer: C

Explanation

  1. 414 − 317 = 97 parts per million.

Worth noting

24 is the rise in the last decade alone; 31 is the percentage rise, not ppm.

Concept
Reading a CO₂ graph
Typical time
70 s
Your time
—
The rule this testsGlobal warming and ozone depletion
Practise this chapter →

Ten questions from Environment & Sustainable Development, at your own pace.

Practise this chapter →

Ten questions from Environment & Sustainable Development, at your own pace.