Question 23
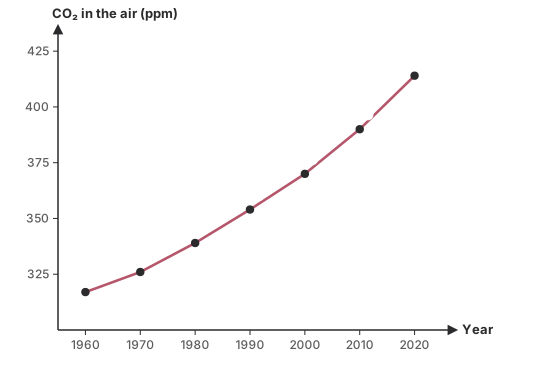
HardOriginal questionWhat does the graph shown suggest about the pace at which carbon dioxide is building up?
Show the answer and explanation
CorrectNot quiteAnswer B
Correct answer: B
Explanation
Rise per decade: 9, 13, 15, 16, 20, 24 ppm, getting larger each time.
- Concept
- Reading a CO₂ graph
- Typical timeTypical
- 100 s
- Your timeYours
- —
Practise this chapter →
Ten questions from Environment & Sustainable Development, at your own pace.