EduFarming
Your list · 0हिं

Type at least two letters. Press Esc to close.

↑↓ navigate↵ openTAB cycle filter

Excess & Deficient Demand · Question 33 of 53

The graph shows AD₂ below AD.

Question 33

HardOriginal question

The graph shows AD₂ below AD. If AD₂ is raised by ₹60 crore at every income, equilibrium income rises by
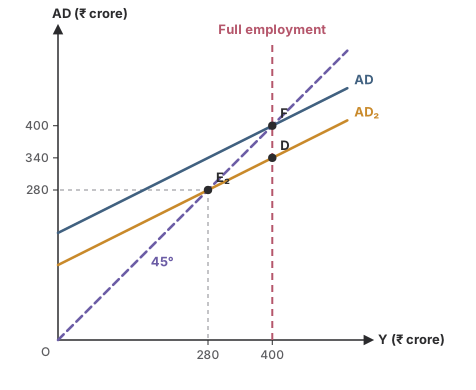
A dashed 45° line, an AD line that meets it at F at the full-employment income of ₹400 crore, and a lower line AD₂. At ₹400 crore of income, AD₂ is ₹340 crore (point D), ₹60 crore below F. AD₂ meets the 45° line at E₂, at an income of ₹280 crore.
Options for question 33

Show the answer and explanation
CorrectNot quiteAnswer B

Correct answer: B

Explanation

  1. Raising AD₂ by 60 makes it AD, which meets the 45° line at F (₹400 crore).

  2. Income rises from E₂ (280) to F (400), by ₹120 crore: the multiplier, 2 here, at work.

Concept
Closing the deflationary gap
Typical time
100 s
Your time
—
The rule this testsDeficient demand and the deflationary gap
Practise this chapter →

Ten questions from Excess & Deficient Demand, at your own pace.

Practise this chapter →

Ten questions from Excess & Deficient Demand, at your own pace.