EduFarming
Your list · 0हिं

Type at least two letters. Press Esc to close.

↑↓ navigate↵ openTAB cycle filter

Foreign Exchange Rate · Question 25 of 50

The graph shows the supply of dollars rising from S₁ to S₂.

Question 25

MediumOriginal question

The graph shows the supply of dollars rising from S₁ to S₂. Which event could cause this?
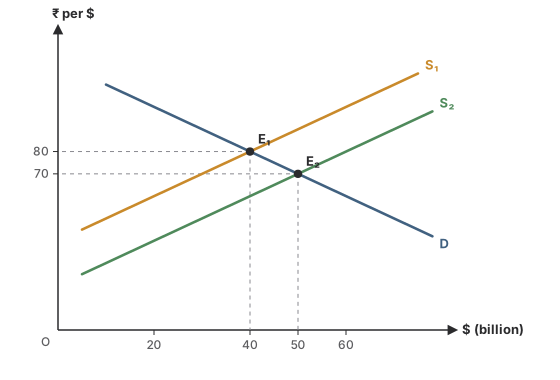
The supply of dollars shifts right from S₁ to S₂ while demand D stays put. Equilibrium moves from E₁ (₹80 per dollar, $40 billion) to E₂ (₹70 per dollar, $50 billion).
Options for question 25

Show the answer and explanation
CorrectNot quiteAnswer B

Correct answer: B

Explanation

  1. Foreign investors bring in dollars to buy rupee assets, adding to supply at every rate.

  2. The other three raise the demand for dollars.

Concept
What shifts supply of forex
Typical time
70 s
Your time
—
The rule this testsThe flexible rate: depreciation and appreciation
Practise this chapter →

Ten questions from Foreign Exchange Rate, at your own pace.

Practise this chapter →

Ten questions from Foreign Exchange Rate, at your own pace.