EduFarming
Your list · 0हिं

Type at least two letters. Press Esc to close.

↑↓ navigate↵ openTAB cycle filter

Human Capital Formation · Question 43 of 51

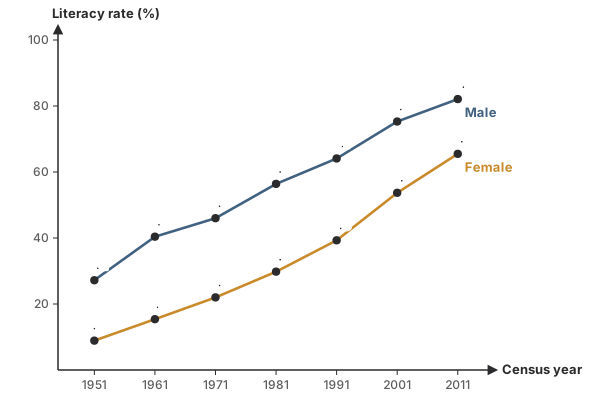
What does the graph shown tell us about the gender gap in literacy since 1981?
Question 43

MediumOriginal question

What does the graph shown tell us about the gender gap in literacy since 1981?

A line graph of male and female literacy rates in India at each census. Male: 27.2% in 1951, 40.4 in 1961, 46.0 in 1971, 56.4 in 1981, 64.1 in 1991, 75.3 in 2001, 82.1 in 2011. Female: 8.9, 15.4, 22.0, 29.8, 39.3, 53.7, 65.5.
Options for question 43

Show the answer and explanation
CorrectNot quiteAnswer B

Correct answer: B

Explanation

  1. Gap: 26.6 (1981), 24.8 (1991), 21.6 (2001), 16.6 (2011): falling each time.

Concept
Gender gap in literacy
Typical time
70 s
Your time
—
The rule this testsEducation in India
Practise this chapter →

Ten questions from Human Capital Formation, at your own pace.

Practise this chapter →

Ten questions from Human Capital Formation, at your own pace.