Question 51
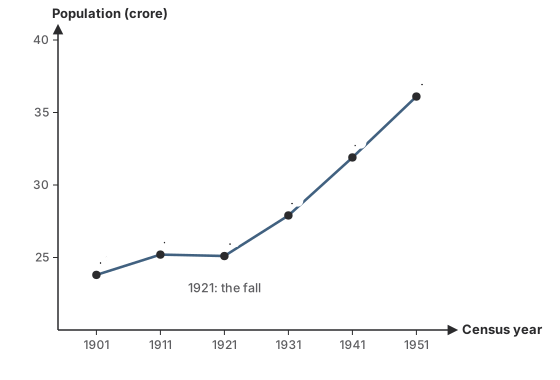
MediumOriginal questionThe graph shows India's population at each census from 1901 to 1951. Between which two censuses did the population fall?
Show the answer and explanation
CorrectNot quiteAnswer A
Correct answer: A
Explanation
The population went from 25.2 crore in 1911 to 25.1 crore in 1921, the only fall on the graph.
Famine, disease and the 1918 influenza raised deaths in that decade.
- Concept
- Population before 1921
- Typical timeTypical
- 70 s
- Your timeYours
- —
Practise this chapter →
Ten questions from The Economy on the Eve of Independence, at your own pace.