EduFarming
Your list · 0हिं

Type at least two letters. Press Esc to close.

↑↓ navigate↵ openTAB cycle filter

The Economy on the Eve of Independence · Question 56 of 69

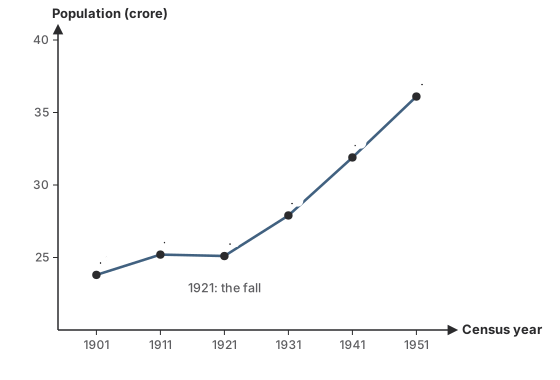
Using the graph shown, by about what per cent did India's population grow between 1941 and 1951?
Question 56

HardOriginal question

Using the graph shown, by about what per cent did India's population grow between 1941 and 1951?

A line graph of India's population at each census: 23.8 crore in 1901, 25.2 in 1911, 25.1 in 1921, 27.9 in 1931, 31.9 in 1941 and 36.1 in 1951.
Options for question 56

Show the answer and explanation
CorrectNot quiteAnswer C

Correct answer: C

Explanation

  1. Increase = 36.1 − 31.9 = 4.2 crore.

  2. Growth = 4.2 ÷ 31.9 × 100 ≈ 13%.

Worth noting

11.6% divides by the 1951 figure; growth is measured on the starting year, 1941.

Concept
Decadal growth rate
Typical time
100 s
Your time
—
The rule this testsPopulation, health and literacy
Practise this chapter →

Ten questions from The Economy on the Eve of Independence, at your own pace.

Practise this chapter →

Ten questions from The Economy on the Eve of Independence, at your own pace.