Question 53
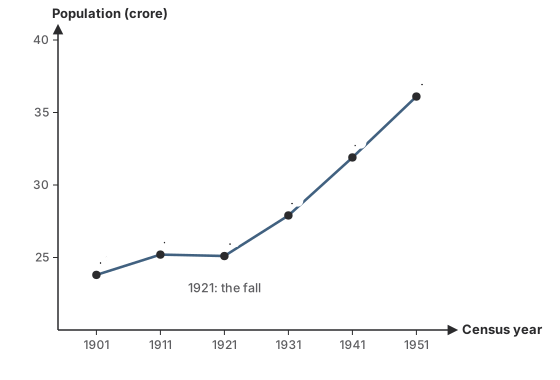
MediumOriginal questionWhat does the graph shown suggest about India's population after 1921?
Show the answer and explanation
CorrectNot quiteAnswer D
Correct answer: D
Explanation
After 1921: +2.8, +4.0 and +4.2 crore in the next three decades.
That is why 1921 is the year of the great divide.
- Concept
- Year of the great divide
- Typical timeTypical
- 70 s
- Your timeYours
- —
Practise this chapter →
Ten questions from The Economy on the Eve of Independence, at your own pace.