EduFarming
Your list · 0हिं

Type at least two letters. Press Esc to close.

↑↓ navigate↵ openTAB cycle filter

Agriculture: Land Reforms & the Green Revolution · Question 34 of 54

The graph shows India's wheat and rice output from 1950-51 to 1990-91.

Question 34

MediumOriginal question

The graph shows India's wheat and rice output from 1950-51 to 1990-91. By how much did wheat output rise between 1960-61 and 1970-71?
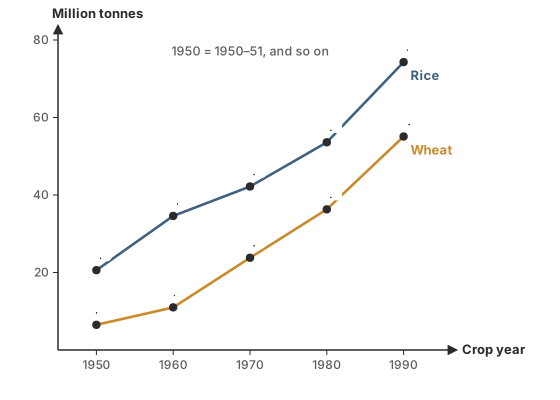
A line graph of India's rice and wheat output in million tonnes, crop years 1950-51 to 1990-91. Rice: 20.6, 34.6, 42.2, 53.6, 74.3. Wheat: 6.5, 11.0, 23.8, 36.3, 55.1.
Options for question 34

Show the answer and explanation
CorrectNot quiteAnswer D

Correct answer: D

Explanation

  1. Wheat: 23.8 − 11.0 = 12.8 million tonnes.

Worth noting

7.6 is rice over the same decade; 12.5 is wheat over the next one.

Concept
Reading a production graph
Typical time
70 s
Your time
—
The rule this testsThe green revolution
Practise this chapter →

Ten questions from Agriculture: Land Reforms & the Green Revolution, at your own pace.

Practise this chapter →

Ten questions from Agriculture: Land Reforms & the Green Revolution, at your own pace.