EduFarming
Your list · 0हिं

Type at least two letters. Press Esc to close.

↑↓ navigate↵ openTAB cycle filter

Agriculture: Land Reforms & the Green Revolution · Question 36 of 54

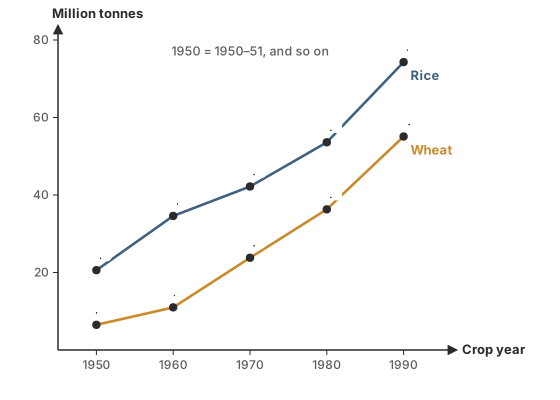
What does the graph shown suggest about the green revolution's early years?
Question 36

MediumOriginal question

What does the graph shown suggest about the green revolution's early years?

A line graph of India's rice and wheat output in million tonnes, crop years 1950-51 to 1990-91. Rice: 20.6, 34.6, 42.2, 53.6, 74.3. Wheat: 6.5, 11.0, 23.8, 36.3, 55.1.
Options for question 36

Show the answer and explanation
CorrectNot quiteAnswer C

Correct answer: C

Explanation

  1. Wheat rose from 11.0 to 23.8 (more than double); rice from 34.6 to 42.2 (about 22%).

  2. The early HYV seeds were mainly wheat.

Concept
Green revolution in the data
Typical time
70 s
Your time
—
The rule this testsThe green revolution
Practise this chapter →

Ten questions from Agriculture: Land Reforms & the Green Revolution, at your own pace.

Practise this chapter →

Ten questions from Agriculture: Land Reforms & the Green Revolution, at your own pace.