EduFarming
Your list · 0हिं

Type at least two letters. Press Esc to close.

↑↓ navigate↵ openTAB cycle filter

Market Equilibrium & Price Controls · Question 46 of 52

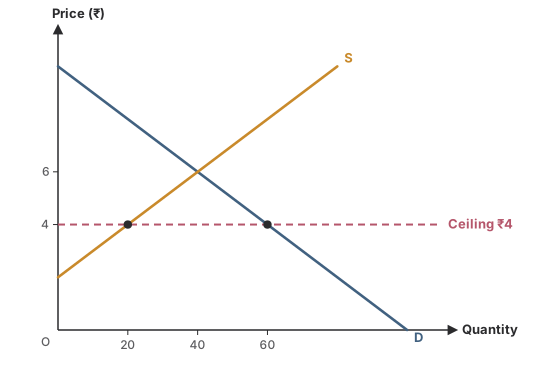
In the graph, how many units are actually bought and sold at the ceiling of ₹4?
Question 46

MediumOriginal question

In the graph, how many units are actually bought and sold at the ceiling of ₹4?

Demand D (Qd = 100 − 10P) and supply S (Qs = 10P − 20) with equilibrium at ₹6. A price ceiling is set at ₹4: there, quantity supplied is 20 and quantity demanded is 60.
Options for question 46

Show the answer and explanation
CorrectNot quiteAnswer D

Correct answer: D

Explanation

  1. Buyers cannot buy more than sellers offer: the smaller of the two quantities is traded.

  2. At ₹4 sellers offer only 20, so only 20 change hands; 40 units of demand go unmet.

Concept
Quantity traded under a ceiling
Typical time
70 s
Your time
—
The rule this testsPrice ceiling and price floor
Practise this chapter →

Ten questions from Market Equilibrium & Price Controls, at your own pace.

Practise this chapter →

Ten questions from Market Equilibrium & Price Controls, at your own pace.