Question 37
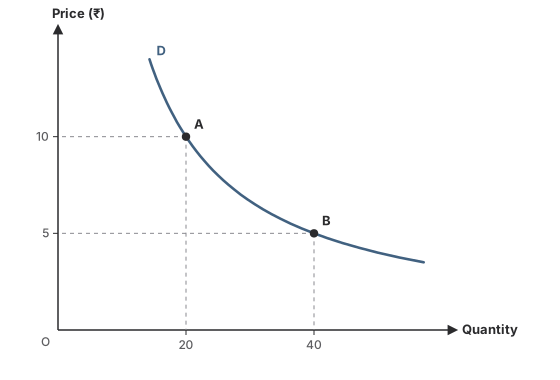
MediumOriginal questionIn the graph, by the total expenditure method, what is demand like along the curve?
Show the answer and explanation
CorrectNot quiteAnswer C
Correct answer: C
Explanation
At A: 10 × 20 = ₹200. At B: 5 × 40 = ₹200. Spending is the same at every point of the curve.
Unchanged spending when price changes is unitary elasticity; such a curve is a rectangular hyperbola.
Worth noting
Doubling quantity alone says nothing; what matters is that spending did not change.
- Concept
- Unitary elasticity on a graph
- Typical timeTypical
- 70 s
- Your timeYours
- —
Practise this chapter →
Ten questions from Price Elasticity of Demand, at your own pace.