EduFarming
Your list · 0हिं

Type at least two letters. Press Esc to close.

↑↓ navigate↵ openTAB cycle filter

Price Elasticity of Demand · Question 48 of 62

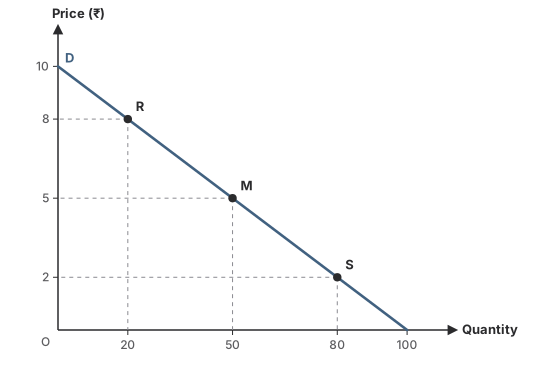
In the graph, between R and M, demand is
Question 48

HardOriginal question

In the graph, between R and M, demand is

A straight-line demand curve D from a price of ₹10 (quantity 0) to a quantity of 100 (price 0), Qd = 100 − 10P. Point R is at ₹8 and 20 units, the midpoint M at ₹5 and 50 units, and S at ₹2 and 80 units.
Options for question 48

Show the answer and explanation
CorrectNot quiteAnswer C

Correct answer: C

Explanation

  1. On a straight-line demand curve, eₚ falls from infinity at the price axis to 1 at the midpoint.

  2. R (eₚ = 4) to M (eₚ = 1) is all on the upper half, so demand is elastic there.

Concept
Upper half of a linear demand curve
Typical time
100 s
Your time
—
The rule this testsDegrees of elasticity
Practise this chapter →

Ten questions from Price Elasticity of Demand, at your own pace.

Practise this chapter →

Ten questions from Price Elasticity of Demand, at your own pace.