Question 8
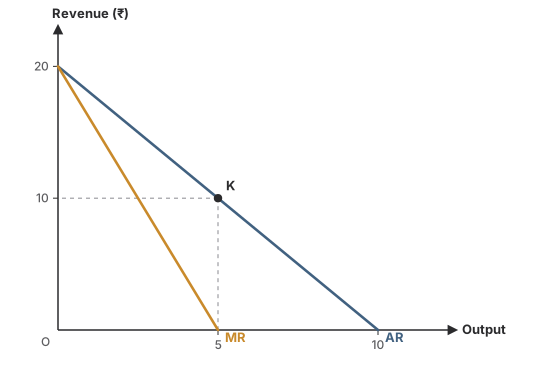
MediumOriginal questionIn the graph, at what output is TR at its maximum, and what is the price there?
Show the answer and explanation
CorrectNot quiteAnswer C
Correct answer: C
Explanation
TR rises while MR is positive and is highest where MR = 0, at 5 units.
The price is read from AR at 5 units: ₹10 (point K). TR = 10 × 5 = ₹50.
Worth noting
MR is 0 at 5 units, but the price is read from AR, not MR.
- Concept
- Maximum TR on a graph
- Typical timeTypical
- 70 s
- Your timeYours
- —
Practise this chapter →
Ten questions from Revenue & Producer's Equilibrium, at your own pace.