EduFarming
Your list · 0हिं

Type at least two letters. Press Esc to close.

↑↓ navigate↵ openTAB cycle filter

Revenue & Producer's Equilibrium · Question 17 of 55

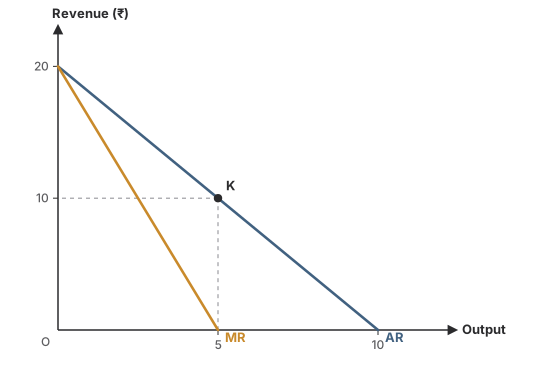
In the graph, what is MR at 5 units, and what does it tell you about TR?
Question 17

MediumOriginal question

In the graph, what is MR at 5 units, and what does it tell you about TR?

A downward-sloping AR line from ₹20 (0 units) to 10 units (₹0), and an MR line from ₹20 down to 5 units (₹0), twice as steep. At 5 units MR is 0 and AR is ₹10 (point K).
Options for question 17

Show the answer and explanation
CorrectNot quiteAnswer B

Correct answer: B

Explanation

  1. The MR line meets the quantity axis at 5 units: MR = 0.

  2. TR rises while MR > 0 and falls once MR < 0, so it peaks at 5 units.

Worth noting

₹10 is AR (the price) at 5 units, not MR.

Concept
MR = 0 on the graph
Typical time
70 s
Your time
—
The rule this testsTotal, average and marginal revenue
Practise this chapter →

Ten questions from Revenue & Producer's Equilibrium, at your own pace.

Practise this chapter →

Ten questions from Revenue & Producer's Equilibrium, at your own pace.