Question 37
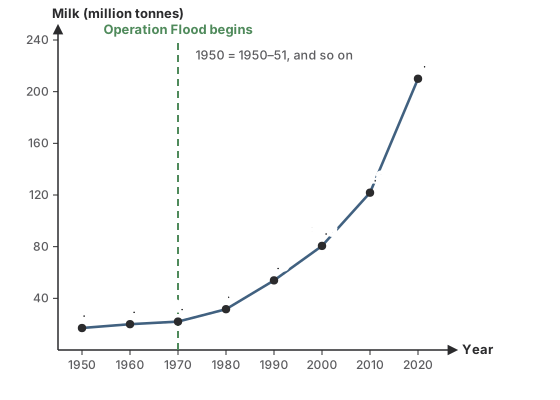
MediumOriginal questionThe graph shows India's milk production from 1950-51 to 2020-21. By how much did it rise between 1970-71 and 1990-91?
Show the answer and explanation
CorrectNot quiteAnswer C
Correct answer: C
Explanation
53.9 − 22.0 = 31.9 million tonnes.
In the twenty years before 1970, it had risen by only 22.0 − 17.0 = 5.0.
Worth noting
53.9 is the 1990-91 level, not the rise; 22.3 is the rise over the 1980s alone.
- Concept
- Operation Flood in the data
- Typical timeTypical
- 70 s
- Your timeYours
- —
Practise this chapter →
Ten questions from Rural Development, at your own pace.