EduFarming
Your list · 0हिं

Type at least two letters. Press Esc to close.

↑↓ navigate↵ openTAB cycle filter

Rural Development · Question 40 of 53

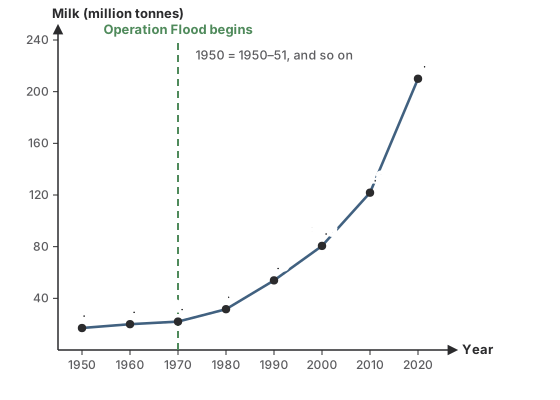
What does the graph shown suggest about milk output before and after Operation Flood began?
Question 40

HardOriginal question

What does the graph shown suggest about milk output before and after Operation Flood began?

A line graph of India's milk production in million tonnes: 17.0 in 1950-51, 20.0 in 1960-61, 22.0 in 1970-71, 31.6 in 1980-81, 53.9 in 1990-91, 80.6 in 2000-01, 121.8 in 2010-11 and 210.0 in 2020-21. A vertical line marks 1970, when Operation Flood began.
Options for question 40

Show the answer and explanation
CorrectNot quiteAnswer B

Correct answer: B

Explanation

  1. 1950-51 to 1970-71: +5.0 million tonnes in twenty years.

  2. 1970-71 to 1990-91: +31.9 in twenty years, and faster still after that.

Concept
Operation Flood in the data
Typical time
100 s
Your time
—
The rule this testsDiversification
Practise this chapter →

Ten questions from Rural Development, at your own pace.

Practise this chapter →

Ten questions from Rural Development, at your own pace.