Question 62
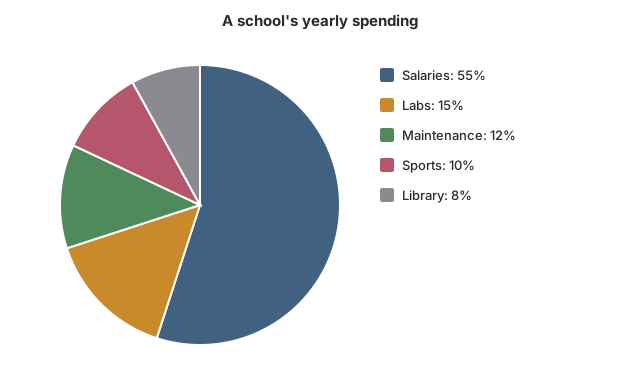
EasyOriginal questionA Chennai school spent ₹80,00,000 last year, split among heads as the chart shows. How much did it spend on labs?
Show the answer and explanation
CorrectNot quiteAnswer C
Correct answer: C
Explanation
Labs take 15% of the spending.
, so labs got ₹12,00,000.
Worth noting
₹15,00,000 reads 15% as 15 lakh rupees. ₹9,60,000 is the maintenance slice (12%). ₹8,00,000 is the sports slice (10%).
- Concept
- Converting a percentage slice into rupees
- Typical timeTypical
- 45 s
- Your timeYours
- —
Practise this chapter →
Ten questions from Data Interpretation, at your own pace.