EduFarming
Your list · 0हिं

Type at least two letters. Press Esc to close.

↑↓ navigate↵ openTAB cycle filter

Data Interpretation for CUET General Aptitude

About 10 min to learn · 75 questions

CUET's data interpretation questions give a small table, bar graph, line graph or pie chart and ask three or four questions about it. The arithmetic is Class 10: percentages, ratios, averages and differences. What costs marks is reading the wrong row, dividing by the wrong base, or working exactly when a rough estimate would pick the answer. This lesson shows how to read each display and answer the standard questions fast.

Syllabus area
Reasoning
On this page · 12 sections
  1. 01The core idea
  2. 02Tables
  3. 03Bar graphs
  4. 04Line graphs
  5. 05Pie charts
  6. 06Percentages on charts
  7. 07Ratios and averages
  8. 08Approximation
  9. 09Exam shortcuts
  10. 10Common mistakes
  11. 11Quick revision
  12. 12Check your understanding

The core idea

Every data interpretation question is one of six types: a total, a difference, a share, a percentage change, a ratio or an average. Sometimes it ends with "in which year" or "which item", which means working out the same thing for each and comparing.

Spend ten seconds on the display before you calculate anything. Read the title, the units (thousands, lakh, tonnes, degrees), the row and axis labels, and the key if there are two series. Most wrong answers in this topic come from skipping this, not from bad arithmetic. The questions on one display usually build on each other, so keep any total you work out.

Tables

How do you read a data table quickly?

Fix what one row and one column mean, then pull out only the cells the question needs. Do not total every row and column in advance.

A table hides two different wholes: the row total and the column total. Say the question with the word "of" in it, and the number after "of" is your base. "What share of Saturday's glasses were mosambi?" divides by Saturday's total. "What share of all mosambi glasses were sold on Saturday?" divides by the mosambi total.

Example 1 · Same cell, two bases

A juice stall records its sales for three days.

DayOrangeMosambi
Friday6436
Saturday9060
Sunday11090

What percentage of Saturday's glasses were mosambi, and what percentage of all mosambi glasses were sold on Saturday?

  1. Saturday's total is 90+60=15090 + 60 = 150, so the first share is 60150×100=40%\tfrac{60}{150} \times 100 = 40\%.

  2. All mosambi glasses: 36+60+90=18636 + 60 + 90 = 186, so the second share is 60186×100\tfrac{60}{186} \times 100, about 32%.

Answer

40% and about 32%

The same cell gives two answers because the bases differ.

Bar graphs

How do you read a bar graph?

Each bar's height is a value. Read the number printed on the bar, or line its top up with the scale, and compare bars by their numbers, not by how tall they look. A grouped bar graph puts two or more bars side by side in each category, and the key says which colour is which series.

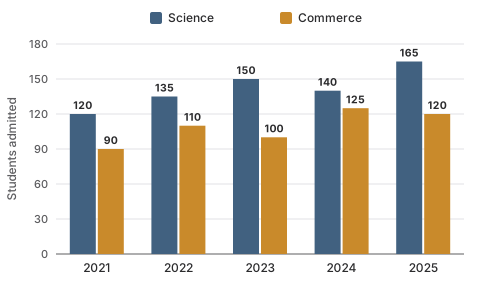
A grouped bar graph of students admitted to Science and Commerce from 2021 to 2025. Science: 120, 135, 150, 140, 165. Commerce: 90, 110, 100, 125, 120.
Students admitted to Class XI at one school, by stream.

Example 2 · Grouped bars

Use the graph above. In which year was the gap between the two streams widest? In how many years did Commerce admit more than 110 students, and in how many at least 110? By what percentage did Science admissions rise from 2021 to 2025?

  1. The gaps are 30, 25, 50, 15 and 45, so the widest is in 2023.

  2. Commerce was 125 in 2024 and 120 in 2025, so more than 110 in 2 years. The 110 of 2022 also counts for "at least", so at least 110 in 3 years.

  3. Science rose by 165−120=45165 - 120 = 45, and 45120×100=37.5%\tfrac{45}{120} \times 100 = 37.5\%.

Answer

2023; 2 years and 3 years; 37.5%

Watch out

Check where the scale starts. If the axis starts above zero, a bar twice as tall is not twice the value. And a bar exactly on a threshold counts for "at least", never for "more than".

Exam shortcut

With grouped bars, decide first whether the question follows one colour across the years (a trend) or compares the two colours within one year (a gap).

Line graphs

How do you read a line graph?

A line graph shows how a value changes over time. Each point is a reading, and the slope between two points is the change. With two lines, the vertical gap between them at one point is the difference between the series then, which is exactly what a profit question asks for.

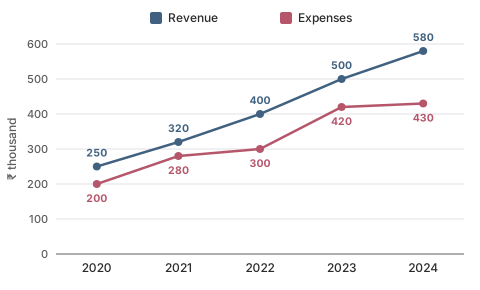
A line graph of a café's revenue and expenses in thousands of rupees from 2020 to 2024. Revenue: 250, 320, 400, 500, 580. Expenses: 200, 280, 300, 420, 430.
A café's revenue and expenses, in ₹ thousand.

Example 3 · Two lines

Use the graph above. What was the profit in 2023? In which year was the profit highest? In which year did revenue grow by the largest percentage?

  1. Profit in 2023: 500−420=80500 - 420 = 80, so ₹80 thousand.

  2. The profits from 2020 are 50, 40, 100, 80 and 150, so the highest is in 2024.

  3. Revenue rose by 70, 80, 100 and 80. As percentages: 70250=28%\tfrac{70}{250} = 28\%, 80320=25%\tfrac{80}{320} = 25\%, 100400=25%\tfrac{100}{400} = 25\% and 80500=16%\tfrac{80}{500} = 16\%.

Answer

₹80 thousand; 2024; 2021

The biggest rise in rupees, 100 in 2023, is not the biggest rise in percentage, 28% in 2021.

Key idea

A steep segment means a big change in numbers. A big percentage change needs a big change relative to a small starting value, so an early, gentler segment can beat a later, steeper one.

Pie charts

How do you read a pie chart given in percentages or degrees?

A pie chart splits one whole into parts. Slices in percentages add up to 100%, and slices in degrees add up to 360°. To turn a slice into an amount you need the total, which the question states.

FromToRule
PercentageAngle×3.6\times 3.6, because 360÷100=3.6360 \div 100 = 3.6
AnglePercentage÷3.6\div 3.6
AngleAmountangle360×total\tfrac{\text{angle}}{360} \times \text{total}
PercentageAmountpercentage100×total\tfrac{\text{percentage}}{100} \times \text{total}
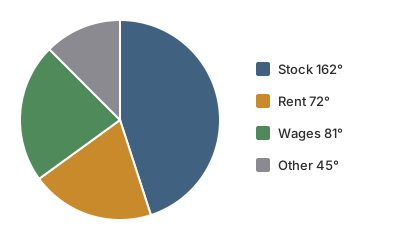
A pie chart of a shop's yearly costs in degrees: stock 162, rent 72, wages 81 and other 45.
A shop's yearly costs of ₹6,00,000, in degrees.

Example 4 · Pie chart in degrees

Use the chart above. How much went on wages? What percentage of the costs is rent? By what percentage is stock more than rent?

  1. Wages: 81360×6,00,000=1,35,000\tfrac{81}{360} \times 6{,}00{,}000 = 1{,}35{,}000, so ₹1,35,000.

  2. Rent: 72÷3.6=20%72 \div 3.6 = 20\%.

  3. Stock over rent: 162−7272×100=9072×100=125%\tfrac{162 - 72}{72} \times 100 = \tfrac{90}{72} \times 100 = 125\%.

Answer

₹1,35,000; 20%; 125%

The third answer needed no total at all.

Exam shortcut

Two slices of one pie compare directly, in degrees or in percentages, because the total cancels. "By what percent is A more than B?" never needs the total.

Watch out

A 72° slice is 20% of the pie, not 72%. Convert degrees before you answer a percentage question.

Percentages on charts

What is the difference between percentage change and percentage points?

Percentage change compares a new value with the old one, divided by the old one. Percentage points are the plain difference between two percentages. A share that goes from 20% to 25% has risen by 5 percentage points, but by 25% of itself.

Percentage change

Percentage change=new−oldold×100\text{Percentage change} = \frac{\text{new} - \text{old}}{\text{old}} \times 100

Example 5 · Points or percent

A town spent 16% of its budget on buses last year and 20% this year. By how many percentage points did the share rise, and by what percentage?

  1. Percentage points: 20−16=420 - 16 = 4.

  2. Percentage rise: 20−1616×100=25%\tfrac{20 - 16}{16} \times 100 = 25\%.

Answer

4 percentage points, a 25% rise

Both are right, for different questions. Read which one is asked.

Watch out

The base is always the value you start from. 40 rising to 50 is a 25% rise, but 50 falling to 40 is a 20% fall. And if August is 300 and June is 150, August is 200% of June but 100% more than June. Questions put both numbers among the options.

Why you cannot average percentages

Percentages of different wholes cannot be added or averaged. A shop's branch A sold ₹200 thousand and branch B ₹800 thousand. Next year A rose by 10% to 220 and B fell by 10% to 720. The total went from 1,000 to 940, a 6% fall, not the 0% that averaging +10% and −10% suggests. Add the actual values first, then compare. More on this in percentages.

Ratios and averages

How do you find ratios and averages from a chart quickly?

For a ratio, write the two values in the question's order and divide both by their highest common factor: 180:240180 : 240 becomes 3:43 : 4 after dividing by 60. For an average, add the values and divide by how many there are, counting carefully.

Example 6 · The right count

A dhaba's daily customers in one week, closed on Tuesday, are shown below. Find the average per day it was open, and the ratio of weekend customers to Monday–Friday customers.

DayMonWedThuFriSatSun
Customers70647682110118
  1. Total: 70+64+76+82+110+118=52070 + 64 + 76 + 82 + 110 + 118 = 520, over 6 open days: 520÷6520 \div 6, about 86.7.

  2. Weekend: 110+118=228110 + 118 = 228. Monday to Friday: 70+64+76+82=29270 + 64 + 76 + 82 = 292.

  3. Ratio: 228:292228 : 292, and dividing both by 4 gives 57:7357 : 73.

Answer

About 86.7 customers a day; 57:7357 : 73

Dividing by 7 gives about 74.3, a classic wrong option.

Chart shortcuts

  • Ratios of totals. To compare two groups, add each group first, then form the ratio. Do not average separate ratios.
  • Deviation method. For 48, 52, 55 and 45, take 50: the deviations −2, +2, +5 and −5 add to 0, so the average is 50.
  • Count the intervals. Readings from January to May give four monthly changes, not five.
  • Target average. If five items must average 60, they must total 300. Subtract what you have to find what is missing.

Approximation

When should you approximate, and how?

Approximate whenever the options are far enough apart that a rough value picks one of them. Round each number to something easy, work it out, and take the closest option. If two options are close, work exactly.

Fraction–percentage pairs make estimates almost instant.

FractionPercentageFractionPercentage
12\tfrac{1}{2}50%15\tfrac{1}{5}20%
13\tfrac{1}{3}about 33.3%16\tfrac{1}{6}about 16.7%
14\tfrac{1}{4}25%18\tfrac{1}{8}12.5%
23\tfrac{2}{3}about 66.7%38\tfrac{3}{8}37.5%

So 47 out of 142 is close to 47141=13\tfrac{47}{141} = \tfrac{1}{3}, about 33%.

Example 7 · Estimating a growth rate

A company's sales rose from ₹4,85,000 to ₹6,02,000. The options are 12%, 18%, 24% and 30%. Which is the growth?

  1. Round to 485 and 600 thousand. The rise is about 115 thousand.

  2. A quarter of 485 is about 121, so 115 is a little under a quarter, just below 25%.

  3. Exact check: 1,17,000÷4,85,0001{,}17{,}000 \div 4{,}85{,}000, about 24.1%.

Answer

24%

Key idea

To compare growth across items, compare each rise with its base. A rise of 300 on 2,400 is one-eighth, 12.5%. A rise of 400 on 4,000 is one-tenth, 10%. The first is larger although its rise in numbers is smaller.

Exam shortcuts

  • Find the base by saying "of". The number after "of" is the denominator.
  • Two slices compare without the total. The same holds for two bars from one series.
  • Degrees and percentages. Multiply or divide by 3.6.
  • Estimate first. With options far apart, one rounded division is enough.
  • Keep your totals. The next question on the same display usually needs them.

Common mistakes

  • The wrong base. Percentage change divides by the old value. "A as a percentage of B" and "A is what percent less than B" both divide by B.
  • Biggest rise taken as biggest percentage rise. Compute the percentages when the question says percentage.
  • Averaging percentages. Add the actual values first.
  • Percent and percentage points confused. 30% to 24% is 6 points, but a 20% fall in the share.
  • Degrees read as percentages. Divide by 3.6.
  • Units and scales. Convert thousands and lakh before answering in rupees, and check where the axis starts.
  • "More than" and "at least". A value on the threshold counts only for "at least".
  • Counting intervals. Six readings give five changes.
  • Reading the wrong series. Confirm the colour in the key before reading a value.

Quick revision

Before you calculate

  • Read the title, units, labels and key
  • Six question types: total, difference, share, percentage change, ratio, average

Displays

  • Table: row total or column total? The word after "of" decides
  • Bars: compare numbers, not heights, and check the scale's start
  • Lines: gap between the lines = difference, as in profit
  • Pie: 360° = 100%, and 1% = 3.6°

Percentages

  • Change = (new − old) ÷ old × 100
  • Points = plain difference of two percentages
  • Never average percentages of different wholes

Ratios, averages, estimates

  • Ratio: keep the order, divide by the HCF
  • Average: divide by the right count
  • Estimate with 13\tfrac{1}{3}, 14\tfrac{1}{4}, 18\tfrac{1}{8} and friends

Percentage change and successive changes are worked in percentages, ratios in ratio and proportion, and medians and modes of chart values in mean, median and mode.

Next · 11Quick revision

Check your understanding

75 questions, grouped by type, easy to hard. Pick an answer and check it. The worked solution opens when you ask for it.

TablesQ1 of 75Q1

Tables

21 questions

The table shows the number of books a shop sold in three months.

MonthTextbooksNovels
April320180
May280220
June400150

In which month was the combined sale of textbooks and novels the highest?

Options for question 1

Show the explanationHide the explanation

AnswerA · June

  1. Add the two columns for each month.

  2. April: 320+180=500320 + 180 = 500. May: 280+220=500280 + 220 = 500. June: 400+150=550400 + 150 = 550.

  3. June is the highest at 550.

Worth noting

April and May do tie at 500, so "April and May were equally high" is a true statement — but it is not the answer, because the question asks which month was highest and neither of them was.

The table shows the number of notebooks a stationery shop in Pune sold in four months.

MonthRuledUnruled
April240160
May200120
June300150
July280120

On average, how many ruled notebooks did the Pune shop sell per month over the four months?

Options for question 2

Show the explanationHide the explanation

AnswerA · 255

  1. Total ruled notebooks: 240+200+300+280=1020240 + 200 + 300 + 280 = 1020.

  2. Average per month: 1020÷4=2551020 \div 4 = 255.

Worth noting

340 divides the four-month total by 3 instead of 4. 300 is the best single month, not the average. 392.5 is the average of ruled and unruled notebooks together.

The table shows a farm's production of wheat and mustard, in quintals, over five years.

YearWheatMustard
2021450120
2022480150
2023400180
2024540160
2025630190

In which year did the farm produce less mustard than it had in the year before?

Options for question 3

Show the explanationHide the explanation

AnswerC · 2024

  1. Mustard each year: 120, 150, 180, 160, 190.

  2. It rises every year except 2024, when it falls from 180 to 160.

Worth noting

2023 is the year wheat fell, not mustard.

The table shows the number of boys and girls in five classes of a school in Guwahati.

ClassBoysGirls
VI4555
VII6040
VIII5248
IX7250
X6357

Across the five classes of the Guwahati school, how many more boys than girls are there?

Options for question 4

Show the explanationHide the explanation

AnswerB · 42

  1. Boys: 45+60+52+72+63=29245 + 60 + 52 + 72 + 63 = 292.

  2. Girls: 55+40+48+50+57=25055 + 40 + 48 + 50 + 57 = 250.

  3. Difference: 292−250=42292 - 250 = 42.

Worth noting

62 counts class VI's gap of 10 as extra boys, but class VI has 10 more girls. 52 leaves out class VI, where girls outnumber boys. 22 is the gap in class IX alone.

The table shows a family's monthly spending, in rupees, for three months.

ItemJanuaryFebruaryMarch
Rent12,00012,00012,000
Food9,0008,4009,600
Transport2,4003,0002,700
Education4,5004,5006,000
Other1,5002,1002,700

What percentage of the family's February spending went on food?

Options for question 5

Show the explanationHide the explanation

AnswerB · 28%

  1. February total: 12,000+8400+3000+4500+2100=30,00012{,}000 + 8400 + 3000 + 4500 + 2100 = 30{,}000.

  2. Food share: 8,40030,000×100=28%\frac{8{,}400}{30{,}000} \times 100 = 28\%.

Worth noting

30.6% is January's food share. 25.5% divides February's food bill by March's total. 70% compares food with rent instead of with the total.

The table shows the average milk, in litres per day, that a dairy cooperative collected from five villages in winter and in summer.

VillageWinterSummer
Rampur1,200840
Sonpur800720
Kheda1,5001,125
Madhopur600570
Bhimgarh900810

By how many litres a day did the cooperative's total summer collection fall short of its winter collection?

Options for question 6

Show the explanationHide the explanation

AnswerD · 935

  1. Winter total: 1,200+800+1,500+600+900=5,0001{,}200 + 800 + 1{,}500 + 600 + 900 = 5{,}000 litres.

  2. Summer total: 840+720+1,125+570+810=4,065840 + 720 + 1{,}125 + 570 + 810 = 4{,}065 litres.

  3. Shortfall: 5,000−4,065=9355{,}000 - 4{,}065 = 935 litres a day.

Worth noting

375 is the fall at Kheda alone. 187 is the average fall per village, not the total shortfall. 360 is the fall at Rampur alone.

The table shows the marks, out of 100, that five students scored in three subjects.

StudentMathsScienceEnglish
Aarav726580
Meenakshi887469
Gurpreet649077
Fatima808371
Tenzin916862

Which of the five students has the highest total across Maths, Science and English?

Options for question 7

Show the explanationHide the explanation

AnswerD · Fatima

  1. Totals: Aarav 217, Meenakshi 231, Gurpreet 231, Fatima 234, Tenzin 221.

  2. Fatima's 234 is the highest.

Worth noting

Tenzin has the highest single mark (91 in Maths) but a total of only 221. Gurpreet has the top Science mark (90) and a total of 231, three short of Fatima's.

The table shows the number of books a shop sold in three months.

MonthTextbooksNovels
April320180
May280220
June400150

In May, novels were what percentage of the shop's total sales for that month?

Options for question 8

Show the explanationHide the explanation

AnswerC · 44%

  1. May's total sale is 280+220=500280 + 220 = 500 books.

  2. Novels accounted for 220 of those.

  3. 220500=0.44\frac{220}{500} = 0.44, which is 44%.

Worth noting

The 55% on offer is the textbook share, 280500=56%\frac{280}{500} = 56\%, misread — and a quick check is that the two shares must add to 100%.

The table shows the number of books a shop sold in three months.

MonthTextbooksNovels
April320180
May280220
June400150

By what percentage did textbook sales fall from April to May?

Options for question 9

Show the explanationHide the explanation

AnswerB · 12.5%

  1. The fall is 320−280=40320 - 280 = 40 books.

  2. A percentage change is taken against the starting figure, which is April's 320.

  3. 40320=0.125\frac{40}{320} = 0.125, which is 12.5%.

Worth noting

Dividing by May's 280 gives about 14.3%. The 40% is the raw fall of 40 books read as a percentage.

The table shows the number of notebooks a stationery shop in Pune sold in four months.

MonthRuledUnruled
April240160
May200120
June300150
July280120

By what percentage did the shop's total notebook sales rise from May to July?

Options for question 10

Show the explanationHide the explanation

AnswerA · 25%

  1. May total: 200+120=320200 + 120 = 320. July total: 280+120=400280 + 120 = 400.

  2. Rise: 400−320=80400 - 320 = 80.

  3. Percentage rise: 80320×100=25%\frac{80}{320} \times 100 = 25\%.

Worth noting

40% is the rise in ruled notebooks alone. 125% is July's total as a percentage of May's, not the rise. 80% mistakes the rise of 80 notebooks for a percentage.

The table shows a farm's production of wheat and mustard, in quintals, over five years.

YearWheatMustard
2021450120
2022480150
2023400180
2024540160
2025630190

By what percentage did the farm's wheat production grow from 2023 to 2025?

Options for question 11

Show the explanationHide the explanation

AnswerD · 57.5%

  1. Growth: 630−400=230630 - 400 = 230 quintals.

  2. Percentage growth: 230400×100=57.5%\frac{230}{400} \times 100 = 57.5\%.

Worth noting

36.5% divides the growth by the 2025 figure instead of the 2023 figure. 28.75% halves the growth as if the question asked for one year; it asks for the whole change from 2023 to 2025. 35% is the growth only up to 2024.

The table shows the number of boys and girls in five classes of a school in Guwahati.

ClassBoysGirls
VI4555
VII6040
VIII5248
IX7250
X6357

In which class of the school do girls make up exactly 40% of the students?

Options for question 12

Show the explanationHide the explanation

AnswerC · VII

  1. Girls' share = girls ÷ (boys + girls) for each class.

  2. VI: 55100=55%\frac{55}{100} = 55\%. VII: 40100=40%\frac{40}{100} = 40\%. VIII: 48100=48%\frac{48}{100} = 48\%.

  3. IX: 50122≈41%\frac{50}{122} \approx 41\%. X: 57120=47.5%\frac{57}{120} = 47.5\%. Only class VII is exactly 40%.

Worth noting

Class IX has 50 girls out of 122, which is about 41%, not 40%. Class VIII has 48 girls out of 100, which is 48%.

The table shows the number of boys and girls in five classes of a school in Guwahati.

ClassBoysGirls
VI4555
VII6040
VIII5248
IX7250
X6357

The school wants the ratio of girls to boys in class IX to become 3:43 : 4 by admitting only new girls. How many girls must it admit?

Options for question 13

Show the explanationHide the explanation

AnswerA · 4

  1. Class IX has 72 boys and 50 girls; the boys do not change.

  2. Girls needed: 72×34=5472 \times \frac{3}{4} = 54.

  3. Girls to admit: 54−50=454 - 50 = 4.

Worth noting

54 is the number of girls class IX needs in all, not the number to admit. 46 reverses the ratio to 4:34 : 3, which would need 96 girls. 22 would make the girls equal to the boys.

The table shows a family's monthly spending, in rupees, for three months.

ItemJanuaryFebruaryMarch
Rent12,00012,00012,000
Food9,0008,4009,600
Transport2,4003,0002,700
Education4,5004,5006,000
Other1,5002,1002,700

By what percentage did the family's total spending go up from February to March?

Options for question 14

Show the explanationHide the explanation

AnswerA · 10%

  1. February total: ₹30,000. March total: ₹33,000.

  2. Increase: ₹3,000. Percentage increase: 3,00030,000×100=10%\frac{3{,}000}{30{,}000} \times 100 = 10\%.

Worth noting

12.2% measures the rise from January instead of February. 33.3% is the rise in education spending alone. 14.3% is the rise in food spending alone.

The table shows the average milk, in litres per day, that a dairy cooperative collected from five villages in winter and in summer.

VillageWinterSummer
Rampur1,200840
Sonpur800720
Kheda1,5001,125
Madhopur600570
Bhimgarh900810

Sonpur's summer collection was what percentage of its winter collection?

Options for question 15

Show the explanationHide the explanation

AnswerD · 90%

  1. Sonpur: winter 800 litres, summer 720 litres.

  2. 720800×100=90%\frac{720}{800} \times 100 = 90\%.

Worth noting

10% is the fall, not what is left. 75% is Kheda's figure, read from the wrong row. 80% mistakes the fall of 80 litres for a percentage.

The table shows the marks, out of 100, that five students scored in three subjects.

StudentMathsScienceEnglish
Aarav726580
Meenakshi887469
Gurpreet649077
Fatima808371
Tenzin916862

What is the mean Science mark of these five students?

Options for question 16

Show the explanationHide the explanation

AnswerB · 76

  1. Science total: 65+74+90+83+68=38065 + 74 + 90 + 83 + 68 = 380.

  2. Mean: 380÷5=76380 \div 5 = 76.

Worth noting

95 divides the total by 4 instead of 5. 79 is the mean Maths mark, read from the wrong column. 74 is the middle mark (the median), not the mean.

The table shows the marks, out of 100, that five students scored in three subjects.

StudentMathsScienceEnglish
Aarav726580
Meenakshi887469
Gurpreet649077
Fatima808371
Tenzin916862

By how many marks would Aarav's English score have to rise for his average over the three subjects to equal Fatima's?

Options for question 17

Show the explanationHide the explanation

AnswerD · 17

  1. Equal averages over the same three subjects means equal totals.

  2. Fatima's total: 234. Aarav's total: 217.

  3. Aarav's English mark must rise by 234−217=17234 - 217 = 17 (from 80 to 97).

Worth noting

6 adds only the gap between the two averages (about 5.7); a rise of 6 in one mark lifts the average by just 2. 14 would match Meenakshi's average, not Fatima's. 3 is the gap between Fatima's and Meenakshi's totals.

The table shows the number of notebooks a stationery shop in Pune sold in four months.

MonthRuledUnruled
April240160
May200120
June300150
July280120

In how many of the four months did ruled notebooks make up more than 60% of that month's notebook sales?

Options for question 18

Show the explanationHide the explanation

AnswerC · 3

  1. April: 240400=60%\frac{240}{400} = 60\%. May: 200320=62.5%\frac{200}{320} = 62.5\%.

  2. June: 300450≈66.7%\frac{300}{450} \approx 66.7\%. July: 280400=70%\frac{280}{400} = 70\%.

  3. May, June and July are above 60%; April is exactly 60%, so the count is 3.

Worth noting

A quick test: the share is more than 60% exactly when ruled notebooks are more than 1.5 times the unruled ones. 4 counts April, where the share is exactly 60%, which is not more than 60%. 2 counts only June and July, the two months with the most ruled notebooks, and misses May.

The table shows a farm's production of wheat and mustard, in quintals, over five years.

YearWheatMustard
2021450120
2022480150
2023400180
2024540160
2025630190

Taking all five years together, the farm's mustard production was what percentage of its wheat production?

Options for question 19

Show the explanationHide the explanation

AnswerA · 32%

  1. Total wheat: 450+480+400+540+630=2500450 + 480 + 400 + 540 + 630 = 2500.

  2. Total mustard: 120+150+180+160+190=800120 + 150 + 180 + 160 + 190 = 800.

  3. Percentage: 8002,500×100=32%\frac{800}{2{,}500} \times 100 = 32\%.

Worth noting

45% is the figure for 2023 alone. 32.5% averages the five yearly percentages; totals must be compared, because the years have different wheat outputs. 312.5% is wheat as a percentage of mustard, the ratio upside down.

The table shows a family's monthly spending, in rupees, for three months.

ItemJanuaryFebruaryMarch
Rent12,00012,00012,000
Food9,0008,4009,600
Transport2,4003,0002,700
Education4,5004,5006,000
Other1,5002,1002,700

Which item's spending rose by the largest percentage from January to March?

Options for question 20

Show the explanationHide the explanation

AnswerB · Other

  1. Food: ₹9,000 to ₹9,600, a rise of 600, which is about 6.7%.

  2. Transport: ₹2,400 to ₹2,700, a rise of 300, which is 12.5%.

  3. Education: ₹4,500 to ₹6,000, a rise of 1,500, which is about 33.3%.

  4. Other: ₹1,500 to ₹2,700, a rise of 1,200, which is 1,2001,500×100=80%\frac{1{,}200}{1{,}500} \times 100 = 80\%. Rent did not change. Other is the largest.

Worth noting

Education has the largest rise in rupees (₹1,500), but on a base of ₹4,500 that is only 33.3%.

The table shows the average milk, in litres per day, that a dairy cooperative collected from five villages in winter and in summer.

VillageWinterSummer
Rampur1,200840
Sonpur800720
Kheda1,5001,125
Madhopur600570
Bhimgarh900810

Which village's milk collection fell by the largest percentage from winter to summer?

Options for question 21

Show the explanationHide the explanation

AnswerC · Rampur

  1. Rampur: fall 360 on 1,200, which is 3601,200×100=30%\frac{360}{1{,}200} \times 100 = 30\%.

  2. Kheda: fall 375 on 1,500, which is 25%. Sonpur and Bhimgarh: 10% each. Madhopur: 5%.

  3. Rampur's 30% is the largest.

Worth noting

Kheda has the largest fall in litres (375), but on 1,500 litres that is 25%, less than Rampur's 30%.

Bar graphs

18 questions

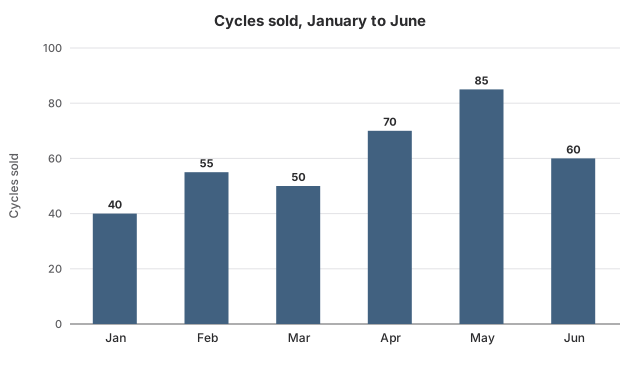
The chart shows how many cycles a shop in Ludhiana sold each month. In how many of the six months did it sell more than 55 cycles?

Bar chart titled Cycles sold, January to June. January: 40 cycles; February: 55 cycles; March: 50 cycles; April: 70 cycles; May: 85 cycles; June: 60 cycles.
Options for question 22

Show the explanationHide the explanation

AnswerC · 3

  1. Monthly sales: 40, 55, 50, 70, 85, 60.

  2. More than 55: April (70), May (85) and June (60), so 3 months.

Worth noting

4 also counts February, when exactly 55 were sold; 55 is not more than 55. 2 misses June, whose 60 is only a little above 55.

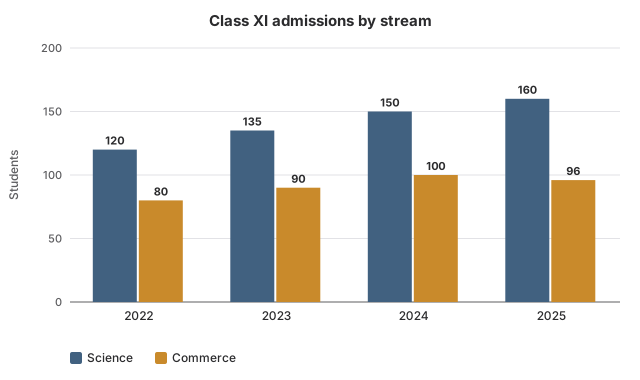
The chart shows how many students joined Class XI in Science and in Commerce at a Jaipur school. In which year was the gap between the two streams the widest?

Grouped bar chart titled Class XI admissions by stream, with bars for Science and Commerce. 2022: Science 120 students, Commerce 80 students; 2023: Science 135 students, Commerce 90 students; 2024: Science 150 students, Commerce 100 students; 2025: Science 160 students, Commerce 96 students.
Options for question 23

Show the explanationHide the explanation

AnswerD · 2025

  1. Gaps: 2022: 120−80=40120 - 80 = 40. 2023: 135−90=45135 - 90 = 45.

  2. 2024: 150−100=50150 - 100 = 50. 2025: 160−96=64160 - 96 = 64, the widest.

Worth noting

2024 has the most Commerce admissions, but its gap is 50, less than 2025's 64.

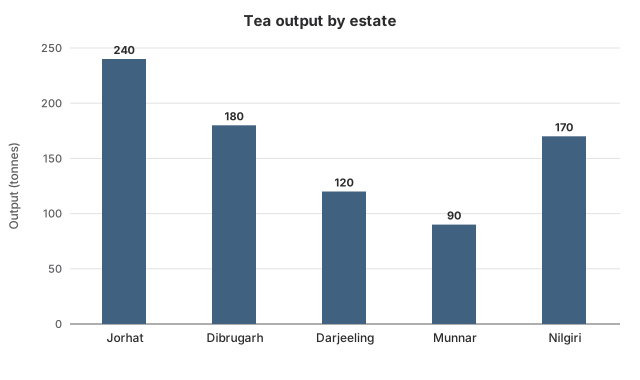
The chart shows how many tonnes of tea each of a company's five estates produced in one year. How many more tonnes did its biggest estate produce than its smallest?

Bar chart titled Tea output by estate. Jorhat: 240 tonnes; Dibrugarh: 180 tonnes; Darjeeling: 120 tonnes; Munnar: 90 tonnes; Nilgiri: 170 tonnes.
Options for question 24

Show the explanationHide the explanation

AnswerD · 150

  1. Biggest: Jorhat, 240 tonnes. Smallest: Munnar, 90 tonnes.

  2. Difference: 240−90=150240 - 90 = 150 tonnes.

Worth noting

60 compares the two biggest estates. 120 uses Darjeeling as the smallest, but Munnar is smaller. 70 compares Jorhat with Nilgiri, the third-largest.

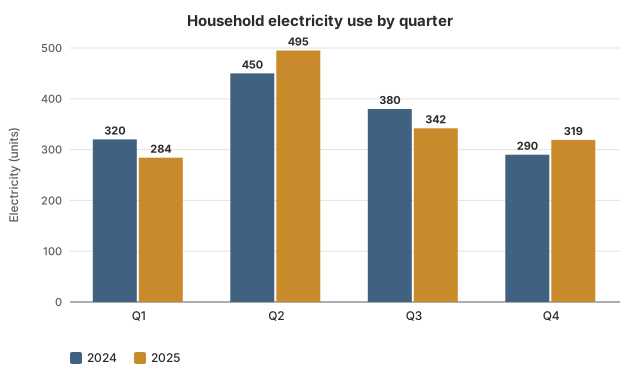
The chart compares how many units of electricity a household used in each quarter of 2024 and of 2025. In how many quarters did it use less electricity in 2025 than in 2024?

Grouped bar chart titled Household electricity use by quarter, with bars for 2024 and 2025. first quarter: 2024 320 units, 2025 284 units; second quarter: 2024 450 units, 2025 495 units; third quarter: 2024 380 units, 2025 342 units; fourth quarter: 2024 290 units, 2025 319 units.
Options for question 25

Show the explanationHide the explanation

AnswerB · 2

  1. Q1: 320 to 284 (less). Q2: 450 to 495 (more).

  2. Q3: 380 to 342 (less). Q4: 290 to 319 (more). So 2 quarters.

Worth noting

1 misses the first quarter, where use fell from 320 to 284.

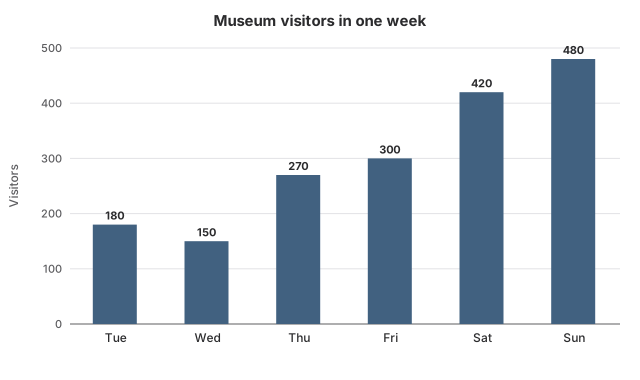
The chart shows the visitors a museum in Kolkata had on each day it was open in one week. Sunday's visitors were how many times Wednesday's?

Bar chart titled Museum visitors in one week. Tuesday: 180 visitors; Wednesday: 150 visitors; Thursday: 270 visitors; Friday: 300 visitors; Saturday: 420 visitors; Sunday: 480 visitors.
Options for question 26

Show the explanationHide the explanation

AnswerD · 3.2

  1. Sunday: 480 visitors. Wednesday: 150 visitors.

  2. 480÷150=3.2480 \div 150 = 3.2.

Worth noting

2.8 uses Saturday instead of Sunday. 0.31 divides Wednesday by Sunday, the ratio upside down. 2.67 uses Tuesday instead of Wednesday.

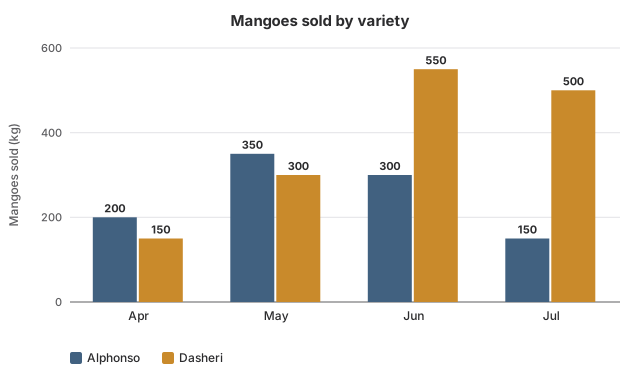
The chart shows how many kilograms of Alphonso and Dasheri mangoes a fruit seller in Lucknow sold each month. In which month did Dasheri sales beat Alphonso sales by the widest margin?

Grouped bar chart titled Mangoes sold by variety, with bars for Alphonso and Dasheri. April: Alphonso 200 kg, Dasheri 150 kg; May: Alphonso 350 kg, Dasheri 300 kg; June: Alphonso 300 kg, Dasheri 550 kg; July: Alphonso 150 kg, Dasheri 500 kg.
Options for question 27

Show the explanationHide the explanation

AnswerA · July

  1. Dasheri minus Alphonso: April −50, May −50, June 250, July 350.

  2. July's margin of 350 kg is the widest.

Worth noting

June has the most Dasheri (550 kg), but the margin is 250 kg, less than July's 350 kg.

The chart shows a Ludhiana shop's monthly cycle sales. By what percentage did its sales rise from March to May?

Bar chart titled Cycles sold, January to June. January: 40 cycles; February: 55 cycles; March: 50 cycles; April: 70 cycles; May: 85 cycles; June: 60 cycles.
Options for question 28

Show the explanationHide the explanation

AnswerD · 70%

  1. March: 50 cycles. May: 85 cycles. Rise: 35.

  2. Percentage rise: 3550×100=70%\frac{35}{50} \times 100 = 70\%.

Worth noting

41.2% divides the rise by May's sales instead of March's. 35% mistakes the rise of 35 cycles for a percentage. 40% is the rise only from March to April.

From the chart of cycles sold at the Ludhiana shop, what is the ratio of sales in January–March to sales in April–June?

Bar chart titled Cycles sold, January to June. January: 40 cycles; February: 55 cycles; March: 50 cycles; April: 70 cycles; May: 85 cycles; June: 60 cycles.
Options for question 29

Show the explanationHide the explanation

AnswerD · 29:4329 : 43

  1. January–March: 40+55+50=14540 + 55 + 50 = 145.

  2. April–June: 70+85+60=21570 + 85 + 60 = 215.

  3. 145:215145 : 215; divide both by 5 to get 29:4329 : 43.

Worth noting

43:2943 : 29 is the ratio the wrong way round. 29:7229 : 72 compares the first three months with all six months. 3:43 : 4 is a rough guess from the bar heights; 145:215145 : 215 does not simplify to it.

According to the chart of the Jaipur school's Class XI admissions, what percentage of the 2024 admissions were in Commerce?

Grouped bar chart titled Class XI admissions by stream, with bars for Science and Commerce. 2022: Science 120 students, Commerce 80 students; 2023: Science 135 students, Commerce 90 students; 2024: Science 150 students, Commerce 100 students; 2025: Science 160 students, Commerce 96 students.
Options for question 30

Show the explanationHide the explanation

AnswerA · 40%

  1. 2024: Science 150, Commerce 100, total 250.

  2. Commerce share: 100250×100=40%\frac{100}{250} \times 100 = 40\%.

Worth noting

66.7% compares Commerce with Science instead of with the year's total. 150% is Science as a percentage of Commerce. 60% is the Science share.

From the chart of the tea company's estate outputs, what percentage of the company's total output came from Darjeeling?

Bar chart titled Tea output by estate. Jorhat: 240 tonnes; Dibrugarh: 180 tonnes; Darjeeling: 120 tonnes; Munnar: 90 tonnes; Nilgiri: 170 tonnes.
Options for question 31

Show the explanationHide the explanation

AnswerA · 15%

  1. Total output: 240+180+120+90+170=800240 + 180 + 120 + 90 + 170 = 800 tonnes.

  2. Darjeeling's share: 120800×100=15%\frac{120}{800} \times 100 = 15\%.

Worth noting

20% assumes every estate has an equal one-fifth share. 50% compares Darjeeling with Jorhat, not with the total. 17.6% divides by the other four estates only.

The tea company in the chart wants its five estates to average 180 tonnes next year. If the other four estates produce exactly what the chart shows, how many tonnes must Munnar produce?

Bar chart titled Tea output by estate. Jorhat: 240 tonnes; Dibrugarh: 180 tonnes; Darjeeling: 120 tonnes; Munnar: 90 tonnes; Nilgiri: 170 tonnes.
Options for question 32

Show the explanationHide the explanation

AnswerC · 190

  1. Required total: 180×5=900180 \times 5 = 900 tonnes.

  2. The other four estates: 240+180+120+170=710240 + 180 + 120 + 170 = 710 tonnes.

  3. Munnar must produce 900−710=190900 - 710 = 190 tonnes.

Worth noting

100 is how much more Munnar must produce, not its new output. 90 is Munnar's present output. 270 adds the target to Munnar's present output.

The chart shows a household's quarterly electricity use in 2024 and 2025. By what percentage did its use in the second quarter (Q2) rise from 2024 to 2025?

Grouped bar chart titled Household electricity use by quarter, with bars for 2024 and 2025. first quarter: 2024 320 units, 2025 284 units; second quarter: 2024 450 units, 2025 495 units; third quarter: 2024 380 units, 2025 342 units; fourth quarter: 2024 290 units, 2025 319 units.
Options for question 33

Show the explanationHide the explanation

AnswerA · 10%

  1. Q2 use: 450 units in 2024, 495 units in 2025. Rise: 45 units.

  2. Percentage rise: 45450×100=10%\frac{45}{450} \times 100 = 10\%.

Worth noting

11.25% is the change in the first quarter, not the second. 45% mistakes the rise of 45 units for a percentage. 110% is the 2025 use as a percentage of 2024's.

The Kolkata museum in the chart is closed on Mondays. What was its average number of visitors per day over the days it was open?

Bar chart titled Museum visitors in one week. Tuesday: 180 visitors; Wednesday: 150 visitors; Thursday: 270 visitors; Friday: 300 visitors; Saturday: 420 visitors; Sunday: 480 visitors.
Options for question 34

Show the explanationHide the explanation

AnswerB · 300

  1. Total: 180+150+270+300+420+480=1,800180 + 150 + 270 + 300 + 420 + 480 = 1{,}800 visitors.

  2. Open days: 6. Average: 1,800÷6=3001{,}800 \div 6 = 300.

Worth noting

257.14 divides by 7, but the museum was open on only 6 days. 360 divides by 5. 315 averages only the busiest and quietest days.

At the museum shown in the chart, a ticket costs ₹40 from Tuesday to Friday and ₹60 on Saturday and Sunday. What percentage of the week's ticket income came from Saturday and Sunday?

Bar chart titled Museum visitors in one week. Tuesday: 180 visitors; Wednesday: 150 visitors; Thursday: 270 visitors; Friday: 300 visitors; Saturday: 420 visitors; Sunday: 480 visitors.
Options for question 35

Show the explanationHide the explanation

AnswerC · 60%

  1. Tuesday to Friday: 180+150+270+300=900180 + 150 + 270 + 300 = 900 visitors, paying ₹36,000.

  2. Saturday and Sunday: 420+480=900420 + 480 = 900 visitors, paying ₹54,000.

  3. Weekend share: 54,00090,000×100=60%\frac{54{,}000}{90{,}000} \times 100 = 60\%.

Worth noting

50% is the weekend share of visitors, not of income; weekend tickets cost more. 150% compares weekend income with weekday income instead of with the total. 40% is the weekday share.

According to the Lucknow fruit seller's chart, what percentage of all the mangoes sold over the four months were Alphonso?

Grouped bar chart titled Mangoes sold by variety, with bars for Alphonso and Dasheri. April: Alphonso 200 kg, Dasheri 150 kg; May: Alphonso 350 kg, Dasheri 300 kg; June: Alphonso 300 kg, Dasheri 550 kg; July: Alphonso 150 kg, Dasheri 500 kg.
Options for question 36

Show the explanationHide the explanation

AnswerA · 40%

  1. Alphonso: 200+350+300+150=1,000200 + 350 + 300 + 150 = 1{,}000 kg. Dasheri: 150+300+550+500=1,500150 + 300 + 550 + 500 = 1{,}500 kg.

  2. Alphonso share: 1,0002,500×100=40%\frac{1{,}000}{2{,}500} \times 100 = 40\%.

Worth noting

66.7% compares Alphonso with Dasheri instead of with the total. 60% is the Dasheri share. 57.1% is the Alphonso share in April alone.

Using the chart of Class XI admissions at the Jaipur school, by what percentage did total admissions grow from 2022 to 2025?

Grouped bar chart titled Class XI admissions by stream, with bars for Science and Commerce. 2022: Science 120 students, Commerce 80 students; 2023: Science 135 students, Commerce 90 students; 2024: Science 150 students, Commerce 100 students; 2025: Science 160 students, Commerce 96 students.
Options for question 37

Show the explanationHide the explanation

AnswerD · 28%

  1. Total in 2022: 120+80=200120 + 80 = 200. Total in 2025: 160+96=256160 + 96 = 256.

  2. Growth: 256−200=56256 - 200 = 56.

  3. Percentage growth: 56200×100=28%\frac{56}{200} \times 100 = 28\%.

Worth noting

21.9% divides the growth by the 2025 total instead of the 2022 total. 20% is the growth in Commerce alone. 26.7% averages the two streams' growth rates, which ignores that Science is the bigger stream.

Look at the household electricity chart for 2024 and 2025. How did the household's total use for the whole of 2025 compare with 2024?

Grouped bar chart titled Household electricity use by quarter, with bars for 2024 and 2025. first quarter: 2024 320 units, 2025 284 units; second quarter: 2024 450 units, 2025 495 units; third quarter: 2024 380 units, 2025 342 units; fourth quarter: 2024 290 units, 2025 319 units.
Options for question 38

Show the explanationHide the explanation

AnswerD · It was exactly the same

  1. 2024 total: 320+450+380+290=1,440320 + 450 + 380 + 290 = 1{,}440 units.

  2. 2025 total: 284+495+342+319=1,440284 + 495 + 342 + 319 = 1{,}440 units.

  3. The totals are equal, so the yearly use did not change.

Worth noting

To compare totals, add the bars; percentage changes of unequal parts never simply add or average. Seeing +10% in two quarters and −10% in one suggests a net rise, but the quarters have different sizes, so their percentages cannot be added. A fall of about 0.3% is the average of the four quarterly percentage changes, which is not the change in the total. 36 units is the fall in the first quarter alone.

The Lucknow seller in the chart charges ₹80 a kg for Alphonso and ₹30 a kg for Dasheri. What percentage of the four months' mango income came from Alphonso?

Grouped bar chart titled Mangoes sold by variety, with bars for Alphonso and Dasheri. April: Alphonso 200 kg, Dasheri 150 kg; May: Alphonso 350 kg, Dasheri 300 kg; June: Alphonso 300 kg, Dasheri 550 kg; July: Alphonso 150 kg, Dasheri 500 kg.
Options for question 39

Show the explanationHide the explanation

AnswerB · 64%

  1. Alphonso: 1,000 kg × ₹80 = ₹80,000.

  2. Dasheri: 1,500 kg × ₹30 = ₹45,000. Total: ₹1,25,000.

  3. Alphonso's share: 80,0001,25,000×100=64%\frac{80{,}000}{1{,}25{,}000} \times 100 = 64\%.

Worth noting

40% is the Alphonso share by weight; the prices are different, so income shares differ. 72.7% compares only the two prices and ignores how much of each was sold. 177.8% compares Alphonso income with Dasheri income instead of with the total.

Line graphs

18 questions

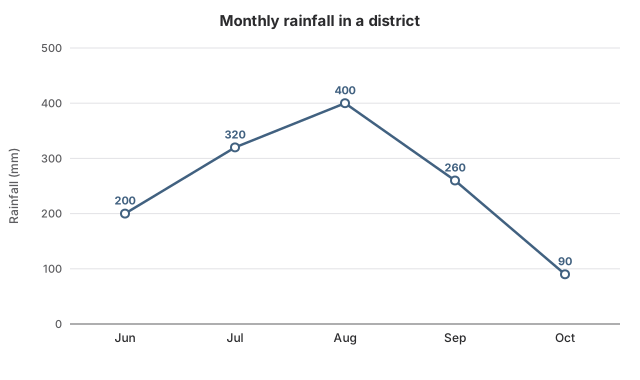
The graph records the rain that fell in a Maharashtra district in each month of one monsoon. Between which two consecutive months did the rainfall drop the most?

Line graph titled Monthly rainfall in a district. Rainfall: June 200 mm; July 320 mm; August 400 mm; September 260 mm; October 90 mm.
Options for question 40

Show the explanationHide the explanation

AnswerB · September to October

  1. The rainfall falls only after August: August to September, 400−260=140400 - 260 = 140 mm.

  2. September to October: 260−90=170260 - 90 = 170 mm, the larger drop.

Worth noting

August to September looks steep, but the drop there is 140 mm, less than the 170 mm from September to October. July to August is a rise, not a drop.

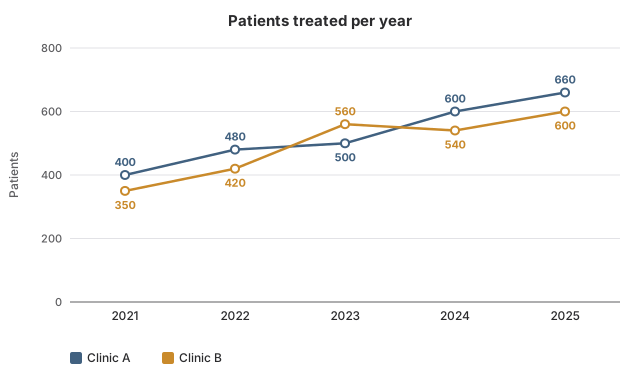
The graph compares two clinics in Bhopal by the patients they saw each year. In which year did Clinic B treat more patients than Clinic A?

Line graph with two lines titled Patients treated per year. Clinic A: 2021 400 patients; 2022 480 patients; 2023 500 patients; 2024 600 patients; 2025 660 patients. Clinic B: 2021 350 patients; 2022 420 patients; 2023 560 patients; 2024 540 patients; 2025 600 patients.
Options for question 41

Show the explanationHide the explanation

AnswerC · 2023

  1. Compare the two lines year by year: Clinic A is higher in 2021, 2022, 2024 and 2025.

  2. Only in 2023 is Clinic B higher: 560 against 500.

Worth noting

In 2024 Clinic B (540) was below Clinic A (600) again.

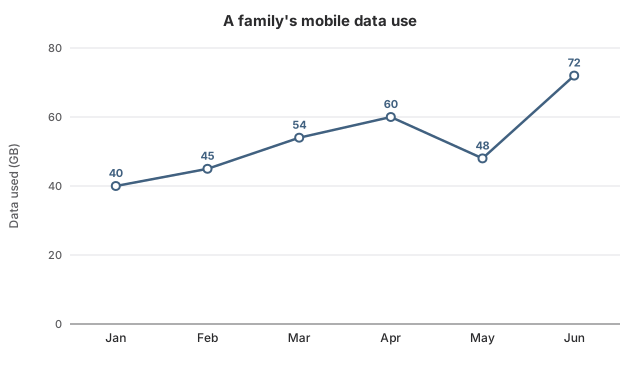
The graph shows how many gigabytes of mobile data a family used in each of six months. In which month did the family use less data than in the month before?

Line graph titled A family's mobile data use. Data used: January 40 GB; February 45 GB; March 54 GB; April 60 GB; May 48 GB; June 72 GB.
Options for question 42

Show the explanationHide the explanation

AnswerA · May

  1. Monthly use: 40, 45, 54, 60, 48, 72 GB.

  2. The only fall is from April (60 GB) to May (48 GB).

Worth noting

June has the steepest part of the line, but it is a rise, from 48 GB to 72 GB.

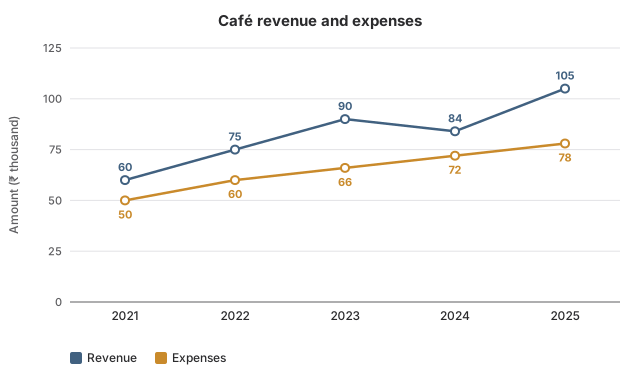
The graph tracks how much a Kochi café earned and spent each year, in thousands of rupees. What was the café's profit (revenue minus expenses) in 2023?

Line graph with two lines titled Café revenue and expenses. Revenue: 2021 60 thousand rupees; 2022 75 thousand rupees; 2023 90 thousand rupees; 2024 84 thousand rupees; 2025 105 thousand rupees. Expenses: 2021 50 thousand rupees; 2022 60 thousand rupees; 2023 66 thousand rupees; 2024 72 thousand rupees; 2025 78 thousand rupees.
Options for question 43

Show the explanationHide the explanation

AnswerC · ₹24,000

  1. 2023: revenue 90 thousand, expenses 66 thousand.

  2. Profit: 90−66=2490 - 66 = 24 thousand rupees, that is ₹24,000.

Worth noting

₹15,000 is the 2022 profit. ₹10,000 is the 2021 profit. ₹27,000 is the 2025 profit.

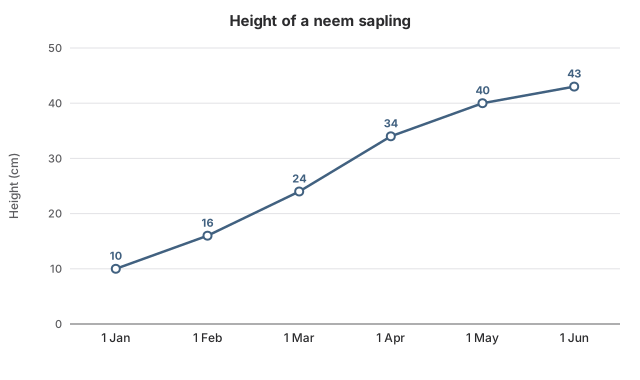
The graph shows measurements of a young neem plant taken on the first day of each month. How much did the plant grow in all from the 1 January measurement to the 1 June measurement?

Line graph titled Height of a neem sapling. Height: 1 January 10 cm; 1 February 16 cm; 1 March 24 cm; 1 April 34 cm; 1 May 40 cm; 1 June 43 cm.
Options for question 44

Show the explanationHide the explanation

AnswerD · 33 cm

  1. Height on 1 January: 10 cm. Height on 1 June: 43 cm.

  2. Growth: 43−10=3343 - 10 = 33 cm.

Worth noting

6 cm is only the growth in the first month. 27 cm starts from 1 February instead of 1 January. 3 cm is only the growth in the last month.

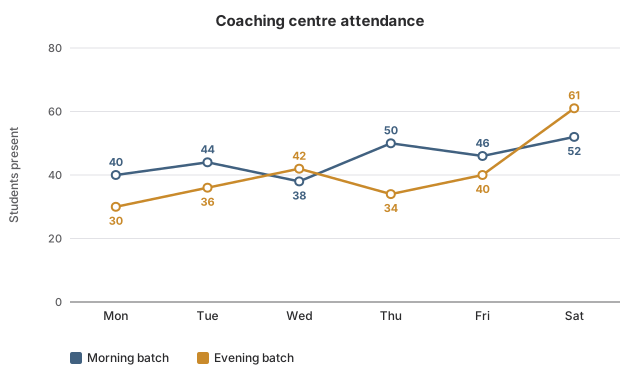
The graph shows how many students attended the morning and evening batches of a coaching centre in Patna on each day of a week. On how many days did the evening batch have more students than the morning batch?

Line graph with two lines titled Coaching centre attendance. Morning batch: Monday 40 students; Tuesday 44 students; Wednesday 38 students; Thursday 50 students; Friday 46 students; Saturday 52 students. Evening batch: Monday 30 students; Tuesday 36 students; Wednesday 42 students; Thursday 34 students; Friday 40 students; Saturday 61 students.
Options for question 45

Show the explanationHide the explanation

AnswerB · 2

  1. Evening above morning: Wednesday (42 against 38) and Saturday (61 against 52).

  2. On every other day the morning batch is larger, so the answer is 2.

Worth noting

1 counts only Saturday and misses Wednesday (42 against 38).

According to the district's rainfall graph, by what percentage was August's rainfall higher than June's?

Line graph titled Monthly rainfall in a district. Rainfall: June 200 mm; July 320 mm; August 400 mm; September 260 mm; October 90 mm.
Options for question 46

Show the explanationHide the explanation

AnswerC · 100%

  1. June: 200 mm. August: 400 mm. Difference: 200 mm.

  2. Percentage: 200200×100=100%\frac{200}{200} \times 100 = 100\%.

Worth noting

50% divides the difference by August's rainfall instead of June's. 25% is the rise only from July to August. 200% is August as a percentage of June: August is 200% OF June but 100% MORE than June.

Using the rainfall graph for the five monsoon months, what was the mean monthly rainfall in the district?

Line graph titled Monthly rainfall in a district. Rainfall: June 200 mm; July 320 mm; August 400 mm; September 260 mm; October 90 mm.
Options for question 47

Show the explanationHide the explanation

AnswerB · 254

  1. Total: 200+320+400+260+90=1,270200 + 320 + 400 + 260 + 90 = 1{,}270 mm.

  2. Mean: 1,270÷5=2541{,}270 \div 5 = 254 mm.

Worth noting

317.5 divides by 4 instead of 5. 295 leaves out October. 245 averages only the wettest and driest months.

From the graph of the two Bhopal clinics, by what percentage did the number of patients at Clinic A rise from 2021 to 2025?

Line graph with two lines titled Patients treated per year. Clinic A: 2021 400 patients; 2022 480 patients; 2023 500 patients; 2024 600 patients; 2025 660 patients. Clinic B: 2021 350 patients; 2022 420 patients; 2023 560 patients; 2024 540 patients; 2025 600 patients.
Options for question 48

Show the explanationHide the explanation

AnswerA · 65%

  1. Clinic A: 400 patients in 2021, 660 in 2025. Rise: 260.

  2. Percentage rise: 260400×100=65%\frac{260}{400} \times 100 = 65\%.

Worth noting

260% mistakes the rise of 260 patients for a percentage. 165% is 2025 as a percentage of 2021, not the rise. 71.4% is Clinic B's rise, read from the wrong line.

According to the family's data-use graph, by what percentage did their monthly use grow from January to March?

Line graph titled A family's mobile data use. Data used: January 40 GB; February 45 GB; March 54 GB; April 60 GB; May 48 GB; June 72 GB.
Options for question 49

Show the explanationHide the explanation

AnswerD · 35%

  1. January: 40 GB. March: 54 GB. Growth: 14 GB.

  2. Percentage growth: 1440×100=35%\frac{14}{40} \times 100 = 35\%.

Worth noting

25.9% divides the growth by March's use instead of January's. 12.5% is the growth only from January to February. 14% mistakes the growth of 14 GB for a percentage.

From the Kochi café's graph, by what percentage did its expenses rise from 2021 to 2025?

Line graph with two lines titled Café revenue and expenses. Revenue: 2021 60 thousand rupees; 2022 75 thousand rupees; 2023 90 thousand rupees; 2024 84 thousand rupees; 2025 105 thousand rupees. Expenses: 2021 50 thousand rupees; 2022 60 thousand rupees; 2023 66 thousand rupees; 2024 72 thousand rupees; 2025 78 thousand rupees.
Options for question 50

Show the explanationHide the explanation

AnswerB · 56%

  1. Expenses: 50 thousand in 2021, 78 thousand in 2025. Rise: 28 thousand.

  2. Percentage rise: 2850×100=56%\frac{28}{50} \times 100 = 56\%.

Worth noting

35.9% divides the rise by the 2025 expenses instead of the 2021 expenses. 75% is the rise in revenue, read from the wrong line. 156% is the 2025 expenses as a percentage of 2021's.

Using the neem sapling graph, what was its average growth per month between the 1 January and 1 June measurements?

Line graph titled Height of a neem sapling. Height: 1 January 10 cm; 1 February 16 cm; 1 March 24 cm; 1 April 34 cm; 1 May 40 cm; 1 June 43 cm.
Options for question 51

Show the explanationHide the explanation

AnswerC · 6.6 cm

  1. Six measurements give five monthly gaps.

  2. Total growth: 43−10=3343 - 10 = 33 cm.

  3. Average: 33÷5=6.633 \div 5 = 6.6 cm per month.

Worth noting

5.5 cm divides by 6, the number of measurements; there are only 5 gaps between them. 6 cm is the middle monthly growth (the median), not the mean. 8.25 cm divides by 4.

According to the Patna coaching centre's attendance graph, what was the average attendance of the morning batch over the six days?

Line graph with two lines titled Coaching centre attendance. Morning batch: Monday 40 students; Tuesday 44 students; Wednesday 38 students; Thursday 50 students; Friday 46 students; Saturday 52 students. Evening batch: Monday 30 students; Tuesday 36 students; Wednesday 42 students; Thursday 34 students; Friday 40 students; Saturday 61 students.
Options for question 52

Show the explanationHide the explanation

AnswerC · 45

  1. Morning total: 40+44+38+50+46+52=27040 + 44 + 38 + 50 + 46 + 52 = 270.

  2. Average: 270÷6=45270 \div 6 = 45.

Worth noting

40.5 is the evening batch's average, read from the wrong line. 54 divides by 5 instead of 6. 42.75 averages both batches together.

Over the whole week shown in the Patna coaching centre's graph, by what percentage was total evening attendance lower than total morning attendance?

Line graph with two lines titled Coaching centre attendance. Morning batch: Monday 40 students; Tuesday 44 students; Wednesday 38 students; Thursday 50 students; Friday 46 students; Saturday 52 students. Evening batch: Monday 30 students; Tuesday 36 students; Wednesday 42 students; Thursday 34 students; Friday 40 students; Saturday 61 students.
Options for question 53

Show the explanationHide the explanation

AnswerA · 10%

  1. Morning total: 270. Evening total: 30+36+42+34+40+61=24330 + 36 + 42 + 34 + 40 + 61 = 243.

  2. Gap: 270−243=27270 - 243 = 27.

  3. Percentage lower: 27270×100=10%\frac{27}{270} \times 100 = 10\%.

Worth noting

11.1% divides the gap by the evening total; 'lower than morning' makes the morning total the base. 27% mistakes the gap of 27 students for a percentage. 90% is evening as a percentage of morning, not the shortfall.

Taking the two Bhopal clinics in the graph together, in which year did the total number of patients rise by the largest percentage over the year before?

Line graph with two lines titled Patients treated per year. Clinic A: 2021 400 patients; 2022 480 patients; 2023 500 patients; 2024 600 patients; 2025 660 patients. Clinic B: 2021 350 patients; 2022 420 patients; 2023 560 patients; 2024 540 patients; 2025 600 patients.
Options for question 54

Show the explanationHide the explanation

AnswerA · 2022

  1. Combined totals: 2021: 750, 2022: 900, 2023: 1,060, 2024: 1,140, 2025: 1,260.

  2. 2022: 150750=20%\frac{150}{750} = 20\%. 2023: 160900≈17.8%\frac{160}{900} \approx 17.8\%.

  3. 2024: 801,060≈7.5%\frac{80}{1{,}060} \approx 7.5\%. 2025: 1201,140≈10.5%\frac{120}{1{,}140} \approx 10.5\%. The largest is 2022.

Worth noting

2023 has the largest rise in numbers (160), but on a base of 900 that is only about 17.8%, less than 2022's 20%.

The family in the data-use graph has a plan that includes 50 GB a month; each GB beyond that in a month costs ₹10. How much did the family pay for extra data over the six months?

Line graph titled A family's mobile data use. Data used: January 40 GB; February 45 GB; March 54 GB; April 60 GB; May 48 GB; June 72 GB.
Options for question 55

Show the explanationHide the explanation

AnswerD · ₹360

  1. Months above 50 GB: March (54), April (60) and June (72).

  2. Extra GB: 4+10+22=364 + 10 + 22 = 36 GB.

  3. Cost: 36×10=36036 \times 10 = 360, that is ₹360.

Worth noting

₹320 misses March, when use of 54 GB went 4 GB over. ₹220 counts only June. ₹190 subtracts the unused GB of the low months, but unused data is not refunded.

For the Kochi café in the graph, in which year was profit the largest percentage of revenue?

Line graph with two lines titled Café revenue and expenses. Revenue: 2021 60 thousand rupees; 2022 75 thousand rupees; 2023 90 thousand rupees; 2024 84 thousand rupees; 2025 105 thousand rupees. Expenses: 2021 50 thousand rupees; 2022 60 thousand rupees; 2023 66 thousand rupees; 2024 72 thousand rupees; 2025 78 thousand rupees.
Options for question 56

Show the explanationHide the explanation

AnswerB · 2023

  1. Profit ÷ revenue: 2021: 10÷60≈16.7%10 \div 60 \approx 16.7\%. 2022: 15÷75=20%15 \div 75 = 20\%.

  2. 2023: 24÷90≈26.7%24 \div 90 \approx 26.7\%. 2024: 12÷84≈14.3%12 \div 84 \approx 14.3\%. 2025: 27÷105≈25.7%27 \div 105 \approx 25.7\%.

  3. The highest share is in 2023.

Worth noting

2025 has the largest profit in rupees (27 thousand), but that is about 25.7% of revenue, below 2023's 26.7%.

Between which two consecutive measurements on the neem sapling graph did its height grow by the largest percentage?

Line graph titled Height of a neem sapling. Height: 1 January 10 cm; 1 February 16 cm; 1 March 24 cm; 1 April 34 cm; 1 May 40 cm; 1 June 43 cm.
Options for question 57

Show the explanationHide the explanation

AnswerD · 1 January to 1 February

  1. 1 January to 1 February: 610×100=60%\frac{6}{10} \times 100 = 60\%.

  2. 1 February to 1 March: 816=50%\frac{8}{16} = 50\%. 1 March to 1 April: 1024≈41.7%\frac{10}{24} \approx 41.7\%.

  3. 1 April to 1 May: 6÷34≈17.6%6 \div 34 \approx 17.6\%. 1 May to 1 June: 3÷40=7.5%3 \div 40 = 7.5\%. The largest is 60%.

Worth noting

1 March to 1 April has the largest growth in cm (10 cm), but on 24 cm that is about 41.7%, less than the 60% from 10 cm to 16 cm. 1 February to 1 March is 8 cm on 16 cm, which is 50%.

Pie charts

18 questions

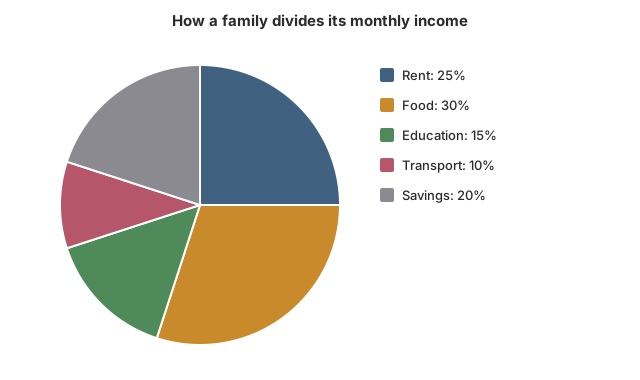
A family in Nagpur earns ₹48,000 a month and splits it as the chart shows. How much does the family spend on food each month?

Pie chart titled How a family divides its monthly income. Rent 25%; Food 30%; Education 15%; Transport 10%; Savings 20%.
Options for question 58

Show the explanationHide the explanation

AnswerD · ₹14,400

  1. Food is 30% of the income.

  2. 0.30×48,000=14,4000.30 \times 48{,}000 = 14{,}400, so food costs ₹14,400.

Worth noting

₹12,000 is the rent slice (25%), not food. ₹9,600 is the savings slice (20%). ₹1,440 slips a decimal place: 30% is 0.3, not 0.03.

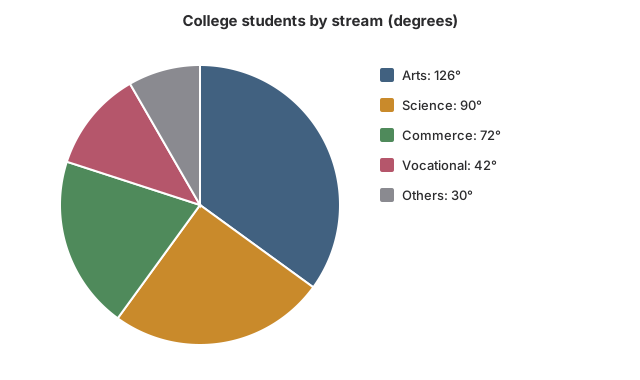
The chart shows how the 1,800 students of a college in Bhubaneswar are split across streams, with each slice given in degrees. How many students study Science?

Pie chart titled College students by stream (degrees). Arts 126 degrees; Science 90 degrees; Commerce 72 degrees; Vocational 42 degrees; Others 30 degrees.
Options for question 59

Show the explanationHide the explanation

AnswerC · 450

  1. Science's slice is 90°, which is 90÷36090 \div 360 = ¼ of the circle.

  2. Students: 90360×1,800=450\frac{90}{360} \times 1{,}800 = 450.

Worth noting

90 is the angle of the slice, not the number of students. 1,620 treats 90° as if it were 90%. 360 is the number of Commerce students.

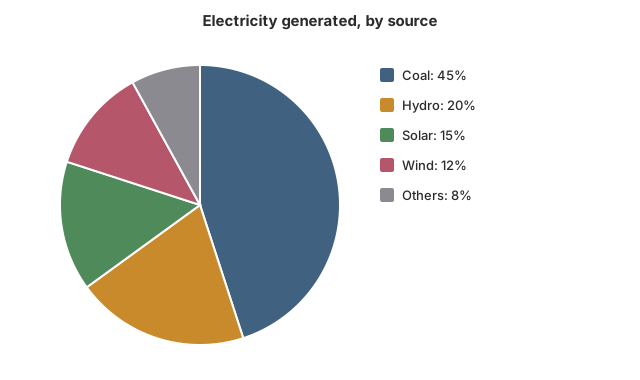
The chart breaks down, source by source, the power a company produced last year. What is the ratio of electricity from solar to electricity from wind?

Pie chart titled Electricity generated, by source. Coal 45%; Hydro 20%; Solar 15%; Wind 12%; Others 8%.
Options for question 60

Show the explanationHide the explanation

AnswerA · 5:45 : 4

  1. Solar: 15%. Wind: 12%. Both are shares of the same total, so compare the percentages directly.

  2. 15:1215 : 12; divide both by 3 to get 5:45 : 4.

Worth noting

4:54 : 5 is wind to solar, the ratio reversed. 3:43 : 4 is solar to hydro (15:20)(15 : 20). 5:95 : 9 compares solar with solar and wind together.

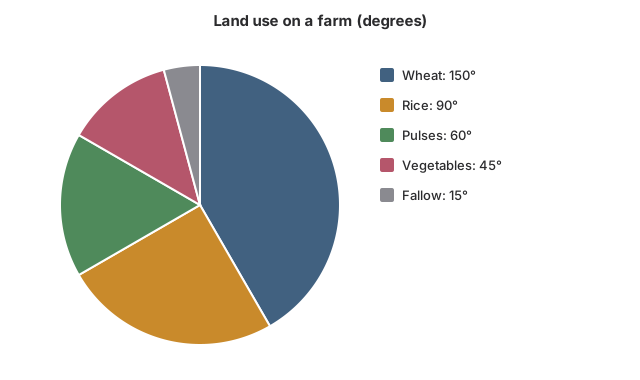
The chart shows how a farmer in Punjab uses his 24 acres of land, with each slice given in degrees. How many acres are under rice?

Pie chart titled Land use on a farm (degrees). Wheat 150 degrees; Rice 90 degrees; Pulses 60 degrees; Vegetables 45 degrees; Fallow 15 degrees.
Options for question 61

Show the explanationHide the explanation

AnswerB · 6 acres

  1. Rice's slice is 90°, a quarter of 360°.

  2. Acres: 90360×24=6\frac{90}{360} \times 24 = 6.

Worth noting

4 acres is the pulses slice (60°). 10 acres is the wheat slice (150°). 25 is the rice share as a percentage, not in acres.

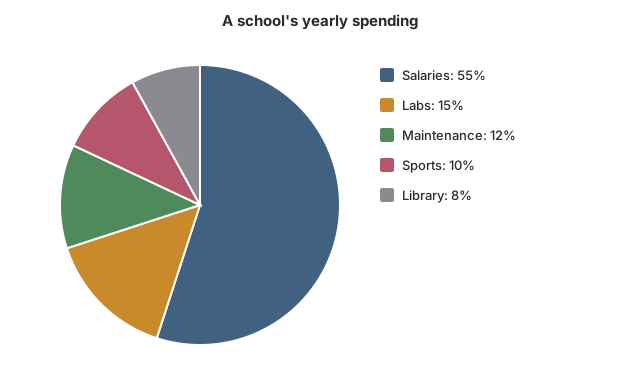
A Chennai school spent ₹80,00,000 last year, split among heads as the chart shows. How much did it spend on labs?

Pie chart titled A school's yearly spending. Salaries 55%; Labs 15%; Maintenance 12%; Sports 10%; Library 8%.
Options for question 62

Show the explanationHide the explanation

AnswerC · ₹12,00,000

  1. Labs take 15% of the spending.

  2. 0.15×80,00,000=12,00,0000.15 \times 80{,}00{,}000 = 12{,}00{,}000, so labs got ₹12,00,000.

Worth noting

₹15,00,000 reads 15% as 15 lakh rupees. ₹9,60,000 is the maintenance slice (12%). ₹8,00,000 is the sports slice (10%).

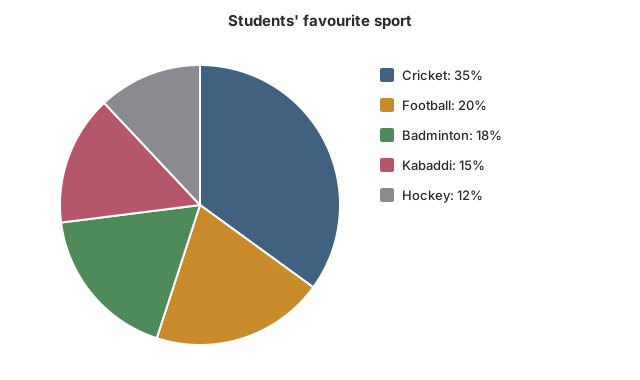
A Srinagar school asked 1,200 students to name the one sport they like best, and the chart shows the results. How many students chose kabaddi?

Pie chart titled Students' favourite sport. Cricket 35%; Football 20%; Badminton 18%; Kabaddi 15%; Hockey 12%.
Options for question 63

Show the explanationHide the explanation

AnswerB · 180

  1. Kabaddi: 15% of 1,200.

  2. 0.15×1,200=1800.15 \times 1{,}200 = 180.

Worth noting

144 is the number who chose hockey (12%). 216 is the number who chose badminton (18%). 240 is the number who chose football (20%).

In the chart of the Nagpur family's income, what is the central angle of the education slice?

Pie chart titled How a family divides its monthly income. Rent 25%; Food 30%; Education 15%; Transport 10%; Savings 20%.
Options for question 64

Show the explanationHide the explanation

AnswerC · 54°

  1. A whole circle is 360°, so each 1% is 3.6°.

  2. Education: 15×3.6=54∘15 \times 3.6 = 54^\circ.

Worth noting

15° forgets to convert: 15% of a circle is 15% of 360°, not 15°. 45° multiplies 15 by 3 instead of by 3.6. 72° is the angle for savings (20%).

According to the Bhubaneswar college's stream chart, how many more students study Arts than Commerce?

Pie chart titled College students by stream (degrees). Arts 126 degrees; Science 90 degrees; Commerce 72 degrees; Vocational 42 degrees; Others 30 degrees.
Options for question 65

Show the explanationHide the explanation

AnswerB · 270

  1. Difference in angle: 126∘−72∘=54∘126^\circ - 72^\circ = 54^\circ.

  2. Each degree stands for 1,800÷360=51{,}800 \div 360 = 5 students.

  3. Difference: 54×5=27054 \times 5 = 270 students.

Worth noting

54 is the difference in degrees, not in students. 630 is the number of Arts students, not the difference. 972 treats the 54° difference as 54%.

In the Bhubaneswar college's stream chart, what percentage of the students are in the Vocational and Others streams taken together?

Pie chart titled College students by stream (degrees). Arts 126 degrees; Science 90 degrees; Commerce 72 degrees; Vocational 42 degrees; Others 30 degrees.
Options for question 66

Show the explanationHide the explanation

AnswerB · 20%

  1. Vocational + Others: 42∘+30∘=72∘42^\circ + 30^\circ = 72^\circ.

  2. Percentage: 72360×100=20%\frac{72}{360} \times 100 = 20\%.

Worth noting

72% takes the combined angle of 72° as a percentage. 25% divides by the other three streams instead of the whole circle. 11.7% counts only the Vocational stream.

The power company in the chart generated 2,40,000 MWh in all. How many more MWh came from coal than from hydro and solar together?

Pie chart titled Electricity generated, by source. Coal 45%; Hydro 20%; Solar 15%; Wind 12%; Others 8%.
Options for question 67

Show the explanationHide the explanation

AnswerA · 24,000 MWh

  1. Coal: 45%. Hydro and solar together: 20%+15%=35%20\% + 15\% = 35\%.

  2. Difference: 10% of the total.

  3. 0.10×2,40,000=24,0000.10 \times 2{,}40{,}000 = 24{,}000 MWh.

Worth noting

60,000 compares coal with hydro alone and leaves out solar. 84,000 is the hydro and solar output itself, not the difference. 1,08,000 is coal's output, not the difference.

Next year, solar output at the power company in the chart rises by 60,000 MWh and every other source produces exactly what it did this year, when the total was 2,40,000 MWh. What share of the new total will solar have?

Pie chart titled Electricity generated, by source. Coal 45%; Hydro 20%; Solar 15%; Wind 12%; Others 8%.
Options for question 68

Show the explanationHide the explanation

AnswerC · 32%

  1. Solar this year: 15% of 2,40,000=36,00015\% \text{ of } 2{,}40{,}000 = 36{,}000 MWh. Next year: 36,000+60,000=96,00036{,}000 + 60{,}000 = 96{,}000 MWh.

  2. New total: 2,40,000+60,000=3,00,0002{,}40{,}000 + 60{,}000 = 3{,}00{,}000 MWh.

  3. Solar's share: 96,0003,00,000×100=32%\frac{96{,}000}{3{,}00{,}000} \times 100 = 32\%.

Worth noting

40% divides the new solar output by the old total; the total grows too. 25% is the increase as a share of the old total. 15% is this year's share.

On the Punjab farm in the chart, by what percentage is the area under wheat greater than the area under pulses?

Pie chart titled Land use on a farm (degrees). Wheat 150 degrees; Rice 90 degrees; Pulses 60 degrees; Vegetables 45 degrees; Fallow 15 degrees.
Options for question 69

Show the explanationHide the explanation

AnswerD · 150%

  1. The areas are in the same ratio as the angles, so no need to find acres.

  2. Wheat: 150°. Pulses: 60°. Difference: 90°.

  3. Percentage: 9060×100=150%\frac{90}{60} \times 100 = 150\%.

Worth noting

60% divides the difference by wheat's area instead of pulses' area. 40% is pulses as a percentage of wheat. 90% mistakes the 90° difference for a percentage.

Using the Chennai school's spending chart, by how many rupees did its spending on sports exceed its spending on the library?

Pie chart titled A school's yearly spending. Salaries 55%; Labs 15%; Maintenance 12%; Sports 10%; Library 8%.
Options for question 70

Show the explanationHide the explanation

AnswerB · ₹1,60,000

  1. Sports: 10%. Library: 8%. Difference: 2% of the spending.

  2. 0.02×80,00,000=1,60,0000.02 \times 80{,}00{,}000 = 1{,}60{,}000, that is ₹1,60,000.

Worth noting

Subtract the percentages first; one multiplication is faster than two. ₹8,00,000 is the sports spending itself. ₹6,40,000 is the library spending itself. ₹16,000 slips a decimal place: 2% is 0.02.

Next year the Chennai school's total spending shown in the chart rises by 10%, and its salary bill rises to ₹52,80,000. What percentage of the new total will go on salaries?

Pie chart titled A school's yearly spending. Salaries 55%; Labs 15%; Maintenance 12%; Sports 10%; Library 8%.
Options for question 71

Show the explanationHide the explanation

AnswerB · 60%

  1. New total: 80,00,000×1.1=88,00,00080{,}00{,}000 \times 1.1 = 88{,}00{,}000.

  2. Salary share: 52,80,00088,00,000×100=60%\frac{52{,}80{,}000}{88{,}00{,}000} \times 100 = 60\%.

Worth noting

66% divides the new salary bill by the old total. 55% is this year's share. 65% adds 10 percentage points to this year's share.

In the Srinagar school's sports survey chart, how many more students chose cricket than football and hockey put together?

Pie chart titled Students' favourite sport. Cricket 35%; Football 20%; Badminton 18%; Kabaddi 15%; Hockey 12%.
Options for question 72

Show the explanationHide the explanation

AnswerA · 36

  1. Football + hockey: 20%+12%=32%20\% + 12\% = 32\%. Cricket: 35%.

  2. Difference: 3% of 1,200.

  3. 0.03×1,200=360.03 \times 1{,}200 = 36 students.

Worth noting

180 compares cricket with football alone. 384 is the football and hockey total itself, not the difference. 276 compares cricket with hockey alone.

The Nagpur family's rent goes up by 20% while its income stays at ₹48,000, and the whole increase is taken out of savings. Using the chart, what percentage of income does the family now save?

Pie chart titled How a family divides its monthly income. Rent 25%; Food 30%; Education 15%; Transport 10%; Savings 20%.
Options for question 73

Show the explanationHide the explanation

AnswerC · 15%

  1. Rent is 25% of income. A 20% rise in rent: 20% of 25%=5%20\% \text{ of } 25\% = 5\% of income.

  2. Rent becomes 30% of income, and savings fall by the same 5 percentage points.

  3. Savings: 20%−5%=15%20\% - 5\% = 15\% of income.

Worth noting

A rise of 20% in one slice is not a rise of 20 percentage points of the whole pie. 0% subtracts 20 percentage points, but the rent rose by 20% of the rent, which is only 5% of income. 16% cuts savings by 20% of the savings instead of taking out the extra rent. 5% is the amount moved from savings to rent, not what is left in savings.

The Punjab farmer in the chart turns all his fallow land and half of his vegetable land over to pulses. What is the central angle of the pulses slice now?

Pie chart titled Land use on a farm (degrees). Wheat 150 degrees; Rice 90 degrees; Pulses 60 degrees; Vegetables 45 degrees; Fallow 15 degrees.
Options for question 74

Show the explanationHide the explanation

AnswerC · 97.5°

  1. Pulses now: 60°. Fallow adds 15°.

  2. Half the vegetable land: half of 45∘=22.5∘45^\circ = 22.5^\circ.

  3. New pulses slice: 60∘+15∘+22.5∘=97.5∘60^\circ + 15^\circ + 22.5^\circ = 97.5^\circ.

Worth noting

The total land does not change, so the angles can be moved from slice to slice directly. 82.5° forgets to add the fallow land. 75° adds only the fallow land and misses the vegetable land. 120° moves all the vegetable land instead of half.

In the Srinagar school's survey shown in the chart, exactly half of the 1,200 students are girls, and 40% of the students who chose cricket are girls. What percentage of the girls chose cricket?

Pie chart titled Students' favourite sport. Cricket 35%; Football 20%; Badminton 18%; Kabaddi 15%; Hockey 12%.
Options for question 75

Show the explanationHide the explanation

AnswerA · 28%

  1. Cricket fans: 35% of 1,200=42035\% \text{ of } 1{,}200 = 420. Girls among them: 40% of 420=16840\% \text{ of } 420 = 168.

  2. Girls in the school: half of 1,200=6001{,}200 = 600.

  3. Share of girls choosing cricket: 168600×100=28%\frac{168}{600} \times 100 = 28\%.

Worth noting

40% of cricket fans are girls is not the same as 40% of girls liking cricket: the base changes from cricket fans to girls. 40% is the share of girls among cricket fans, which answers a different question. 60% is the boys' share of cricket fans. 35% is cricket's share of all students.

The area names are NTA's. The chapters inside them are EduFarming's own division, not NTA's.