Question 33
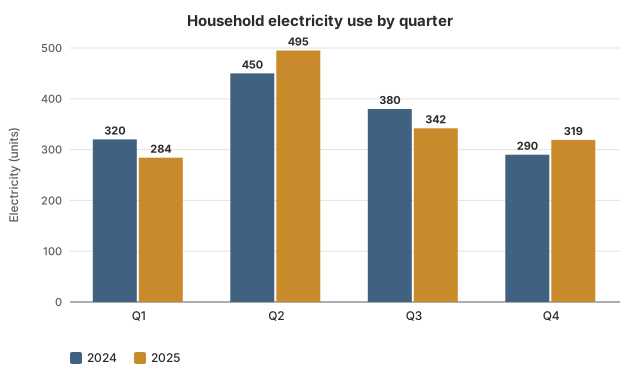
MediumOriginal questionThe chart shows a household's quarterly electricity use in 2024 and 2025. By what percentage did its use in the second quarter (Q2) rise from 2024 to 2025?
Show the answer and explanation
CorrectNot quiteAnswer A
Correct answer: A
Explanation
Q2 use: 450 units in 2024, 495 units in 2025. Rise: 45 units.
Percentage rise: .
Worth noting
11.25% is the change in the first quarter, not the second. 45% mistakes the rise of 45 units for a percentage. 110% is the 2025 use as a percentage of 2024's.
- Concept
- Percentage change between paired bars
- Typical timeTypical
- 80 s
- Your timeYours
- —
Practise this chapter →
Ten questions from Data Interpretation, at your own pace.