EduFarming
Your list · 0हिं

Type at least two letters. Press Esc to close.

↑↓ navigate↵ openTAB cycle filter

Data Interpretation · Question 47 of 75

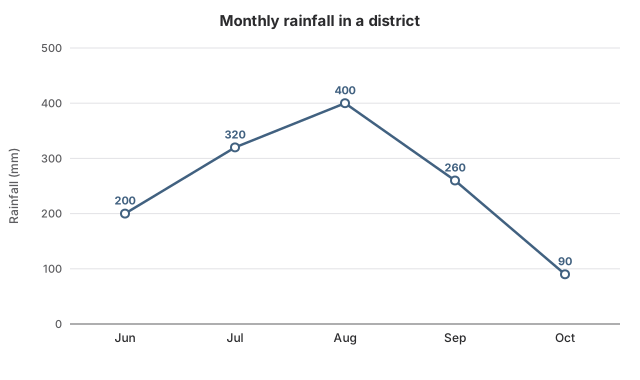
Using the rainfall graph for the five monsoon months, what was the mean monthly rainfall in the district?
Question 47

MediumOriginal question

Using the rainfall graph for the five monsoon months, what was the mean monthly rainfall in the district?

Line graph titled Monthly rainfall in a district. Rainfall: June 200 mm; July 320 mm; August 400 mm; September 260 mm; October 90 mm.
Options for question 47

Show the answer and explanation
CorrectNot quiteAnswer B

Correct answer: B

Explanation

  1. Total: 200+320+400+260+90=1,270200 + 320 + 400 + 260 + 90 = 1{,}270 mm.

  2. Mean: 1,270÷5=2541{,}270 \div 5 = 254 mm.

Worth noting

317.5 divides by 4 instead of 5. 295 leaves out October. 245 averages only the wettest and driest months.

Concept
Mean of the points on a line graph
Typical time
80 s
Your time
—
The rule this testsLine graphs
Practise this chapter →

Ten questions from Data Interpretation, at your own pace.

Practise this chapter →

Ten questions from Data Interpretation, at your own pace.