EduFarming
Your list · 0हिं

Type at least two letters. Press Esc to close.

↑↓ navigate↵ openTAB cycle filter

Data Interpretation · Question 48 of 75

From the graph of the two Bhopal clinics, by what percentage did the number of patients at Clinic A rise…

Question 48

MediumOriginal question

From the graph of the two Bhopal clinics, by what percentage did the number of patients at Clinic A rise from 2021 to 2025?
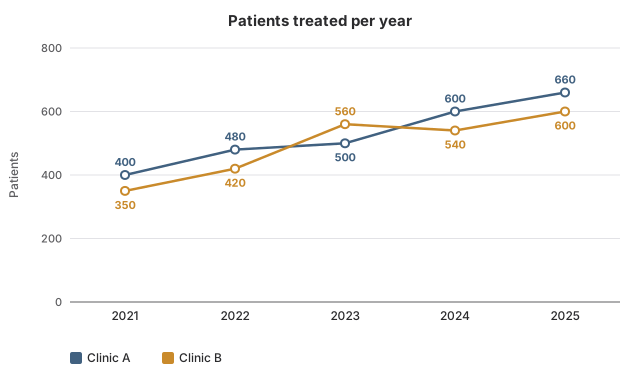
Line graph with two lines titled Patients treated per year. Clinic A: 2021 400 patients; 2022 480 patients; 2023 500 patients; 2024 600 patients; 2025 660 patients. Clinic B: 2021 350 patients; 2022 420 patients; 2023 560 patients; 2024 540 patients; 2025 600 patients.
Options for question 48

Show the answer and explanation
CorrectNot quiteAnswer A

Correct answer: A

Explanation

  1. Clinic A: 400 patients in 2021, 660 in 2025. Rise: 260.

  2. Percentage rise: 260400×100=65%\frac{260}{400} \times 100 = 65\%.

Worth noting

260% mistakes the rise of 260 patients for a percentage. 165% is 2025 as a percentage of 2021, not the rise. 71.4% is Clinic B's rise, read from the wrong line.

Concept
Percentage change along one line
Typical time
80 s
Your time
—
The rule this testsLine graphs
Practise this chapter →

Ten questions from Data Interpretation, at your own pace.

Practise this chapter →

Ten questions from Data Interpretation, at your own pace.