Question 49
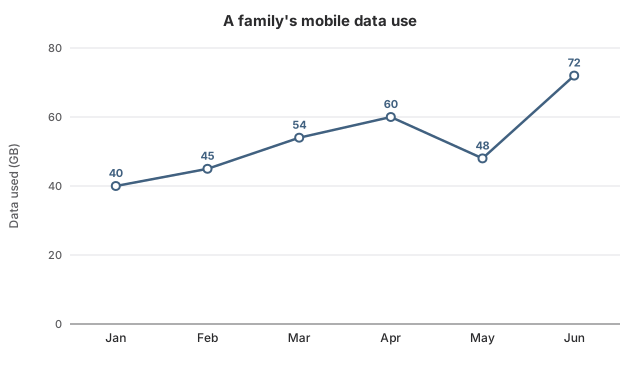
MediumOriginal questionAccording to the family's data-use graph, by what percentage did their monthly use grow from January to March?
Show the answer and explanation
CorrectNot quiteAnswer D
Correct answer: D
Explanation
January: 40 GB. March: 54 GB. Growth: 14 GB.
Percentage growth: .
Worth noting
25.9% divides the growth by March's use instead of January's. 12.5% is the growth only from January to February. 14% mistakes the growth of 14 GB for a percentage.
- Concept
- Percentage change along a line
- Typical timeTypical
- 80 s
- Your timeYours
- —
Practise this chapter →
Ten questions from Data Interpretation, at your own pace.