Question 70
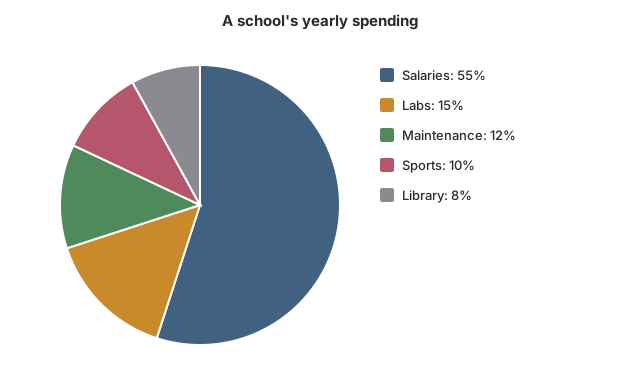
MediumOriginal questionUsing the Chennai school's spending chart, by how many rupees did its spending on sports exceed its spending on the library?
Show the answer and explanation
CorrectNot quiteAnswer B
Correct answer: B
Explanation
Sports: 10%. Library: 8%. Difference: 2% of the spending.
, that is ₹1,60,000.
Worth noting
Subtract the percentages first; one multiplication is faster than two. ₹8,00,000 is the sports spending itself. ₹6,40,000 is the library spending itself. ₹16,000 slips a decimal place: 2% is 0.02.
- Concept
- Difference of two slices in rupees
- Typical timeTypical
- 80 s
- Your timeYours
- —
Practise this chapter →
Ten questions from Data Interpretation, at your own pace.