EduFarming
Your list · 0हिं

Type at least two letters. Press Esc to close.

↑↓ navigate↵ openTAB cycle filter

Data Interpretation · Question 23 of 75

The chart shows how many students joined Class XI in Science and in Commerce at a Jaipur school.

Question 23

EasyOriginal question

The chart shows how many students joined Class XI in Science and in Commerce at a Jaipur school. In which year was the gap between the two streams the widest?
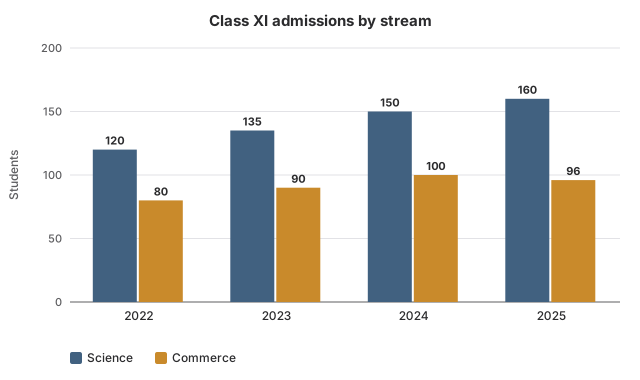
Grouped bar chart titled Class XI admissions by stream, with bars for Science and Commerce. 2022: Science 120 students, Commerce 80 students; 2023: Science 135 students, Commerce 90 students; 2024: Science 150 students, Commerce 100 students; 2025: Science 160 students, Commerce 96 students.
Options for question 23

Show the answer and explanation
CorrectNot quiteAnswer D

Correct answer: D

Explanation

  1. Gaps: 2022: 120−80=40120 - 80 = 40. 2023: 135−90=45135 - 90 = 45.

  2. 2024: 150−100=50150 - 100 = 50. 2025: 160−96=64160 - 96 = 64, the widest.

Worth noting

2024 has the most Commerce admissions, but its gap is 50, less than 2025's 64.

Concept
Comparing differences in a grouped bar chart
Typical time
45 s
Your time
—
The rule this testsBar graphs
Practise this chapter →

Ten questions from Data Interpretation, at your own pace.

Practise this chapter →

Ten questions from Data Interpretation, at your own pace.