Question 44
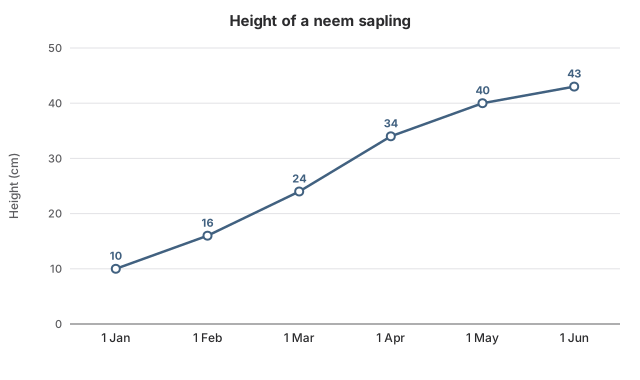
EasyOriginal questionThe graph shows measurements of a young neem plant taken on the first day of each month. How much did the plant grow in all from the 1 January measurement to the 1 June measurement?
Show the answer and explanation
CorrectNot quiteAnswer D
Correct answer: D
Explanation
Height on 1 January: 10 cm. Height on 1 June: 43 cm.
Growth: cm.
Worth noting
6 cm is only the growth in the first month. 27 cm starts from 1 February instead of 1 January. 3 cm is only the growth in the last month.
- Concept
- Change between the first and last points
- Typical timeTypical
- 45 s
- Your timeYours
- —
Practise this chapter →
Ten questions from Data Interpretation, at your own pace.