Question 58
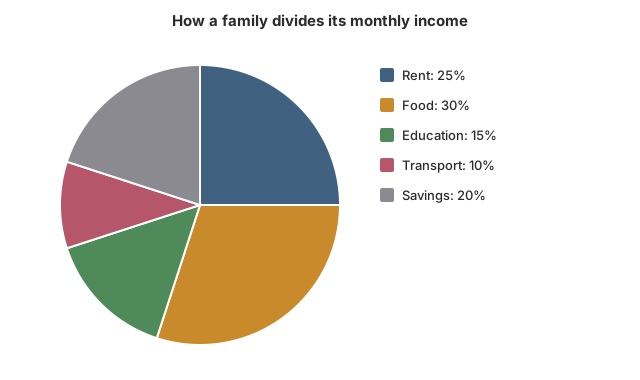
EasyOriginal questionA family in Nagpur earns ₹48,000 a month and splits it as the chart shows. How much does the family spend on food each month?
Show the answer and explanation
CorrectNot quiteAnswer D
Correct answer: D
Explanation
Food is 30% of the income.
, so food costs ₹14,400.
Worth noting
₹12,000 is the rent slice (25%), not food. ₹9,600 is the savings slice (20%). ₹1,440 slips a decimal place: 30% is 0.3, not 0.03.
- Concept
- Converting a pie percentage into an amount
- Typical timeTypical
- 45 s
- Your timeYours
- —
Practise this chapter →
Ten questions from Data Interpretation, at your own pace.