Question 57
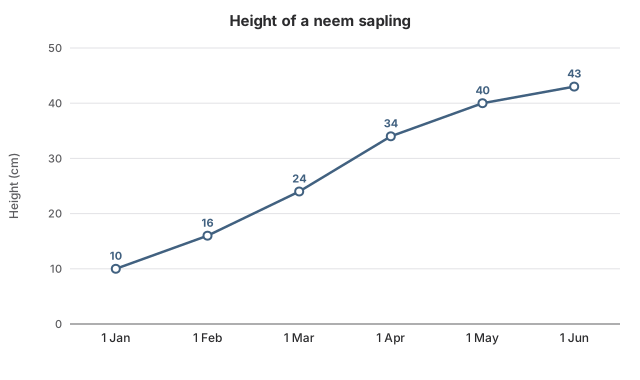
HardOriginal questionBetween which two consecutive measurements on the neem sapling graph did its height grow by the largest percentage?
Show the answer and explanation
CorrectNot quiteAnswer D
Correct answer: D
Explanation
1 January to 1 February: .
1 February to 1 March: . 1 March to 1 April: .
1 April to 1 May: . 1 May to 1 June: . The largest is 60%.
Worth noting
1 March to 1 April has the largest growth in cm (10 cm), but on 24 cm that is about 41.7%, less than the 60% from 10 cm to 16 cm. 1 February to 1 March is 8 cm on 16 cm, which is 50%.
- Concept
- Percentage growth depends on the starting height
- Typical timeTypical
- 120 s
- Your timeYours
- —
Practise this chapter →
Ten questions from Data Interpretation, at your own pace.