Question 51
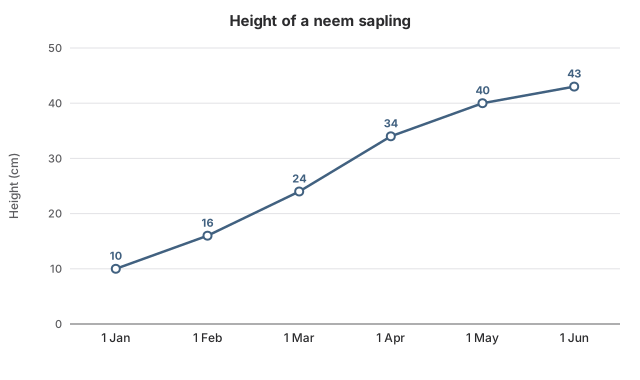
MediumOriginal questionUsing the neem sapling graph, what was its average growth per month between the 1 January and 1 June measurements?
Show the answer and explanation
CorrectNot quiteAnswer C
Correct answer: C
Explanation
Six measurements give five monthly gaps.
Total growth: cm.
Average: cm per month.
Worth noting
5.5 cm divides by 6, the number of measurements; there are only 5 gaps between them. 6 cm is the middle monthly growth (the median), not the mean. 8.25 cm divides by 4.
- Concept
- Average rate over intervals, not points
- Typical timeTypical
- 80 s
- Your timeYours
- —
Practise this chapter →
Ten questions from Data Interpretation, at your own pace.