EduFarming
Your list · 0हिं

Type at least two letters. Press Esc to close.

↑↓ navigate↵ openTAB cycle filter

Data Interpretation · Question 37 of 75

Using the chart of Class XI admissions at the Jaipur school, by what percentage did total admissions grow…

Question 37

HardOriginal question

Using the chart of Class XI admissions at the Jaipur school, by what percentage did total admissions grow from 2022 to 2025?
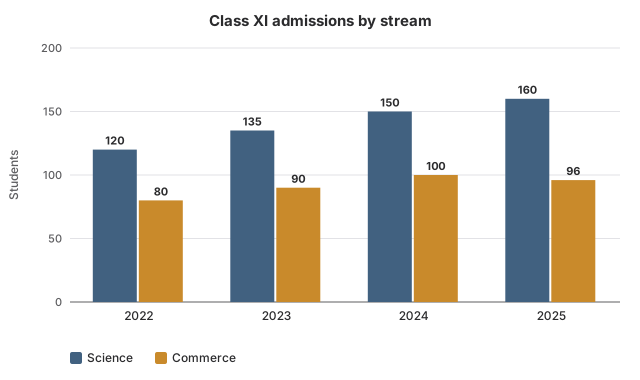
Grouped bar chart titled Class XI admissions by stream, with bars for Science and Commerce. 2022: Science 120 students, Commerce 80 students; 2023: Science 135 students, Commerce 90 students; 2024: Science 150 students, Commerce 100 students; 2025: Science 160 students, Commerce 96 students.
Options for question 37

Show the answer and explanation
CorrectNot quiteAnswer D

Correct answer: D

Explanation

  1. Total in 2022: 120+80=200120 + 80 = 200. Total in 2025: 160+96=256160 + 96 = 256.

  2. Growth: 256−200=56256 - 200 = 56.

  3. Percentage growth: 56200×100=28%\frac{56}{200} \times 100 = 28\%.

Worth noting

21.9% divides the growth by the 2025 total instead of the 2022 total. 20% is the growth in Commerce alone. 26.7% averages the two streams' growth rates, which ignores that Science is the bigger stream.

Concept
Percentage change of a combined total
Typical time
120 s
Your time
—
The rule this testsBar graphs
Practise this chapter →

Ten questions from Data Interpretation, at your own pace.

Practise this chapter →

Ten questions from Data Interpretation, at your own pace.