Question 38
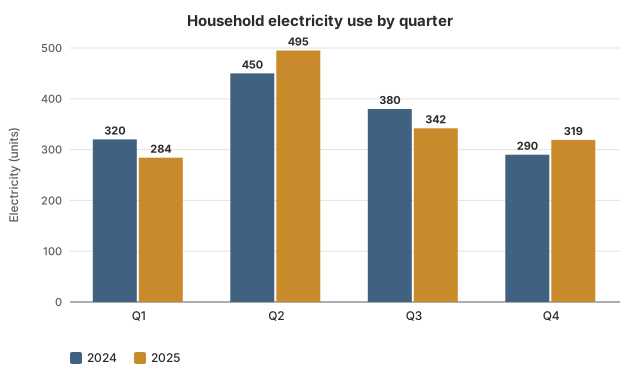
HardOriginal questionLook at the household electricity chart for 2024 and 2025. How did the household's total use for the whole of 2025 compare with 2024?
Show the answer and explanation
CorrectNot quiteAnswer D
Correct answer: D
Explanation
2024 total: units.
2025 total: units.
The totals are equal, so the yearly use did not change.
Worth noting
To compare totals, add the bars; percentage changes of unequal parts never simply add or average. Seeing +10% in two quarters and −10% in one suggests a net rise, but the quarters have different sizes, so their percentages cannot be added. A fall of about 0.3% is the average of the four quarterly percentage changes, which is not the change in the total. 36 units is the fall in the first quarter alone.
- Concept
- Change in a total versus changes in its parts
- Typical timeTypical
- 120 s
- Your timeYours
- —
Practise this chapter →
Ten questions from Data Interpretation, at your own pace.