Question 24
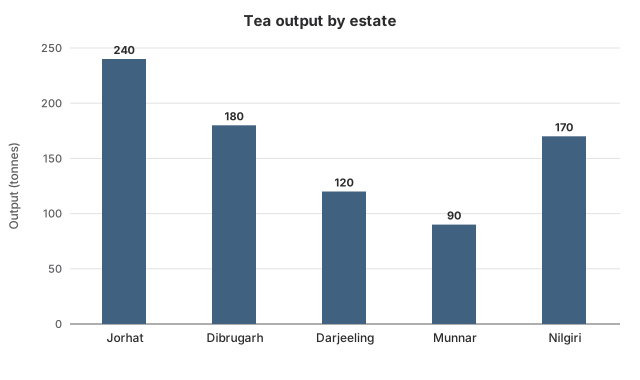
EasyOriginal questionThe chart shows how many tonnes of tea each of a company's five estates produced in one year. How many more tonnes did its biggest estate produce than its smallest?
Show the answer and explanation
CorrectNot quiteAnswer D
Correct answer: D
Explanation
Biggest: Jorhat, 240 tonnes. Smallest: Munnar, 90 tonnes.
Difference: tonnes.
Worth noting
60 compares the two biggest estates. 120 uses Darjeeling as the smallest, but Munnar is smaller. 70 compares Jorhat with Nilgiri, the third-largest.
- Concept
- Difference between the tallest and shortest bars
- Typical timeTypical
- 45 s
- Your timeYours
- —
Practise this chapter →
Ten questions from Data Interpretation, at your own pace.