EduFarming
Your list · 0हिं

Type at least two letters. Press Esc to close.

↑↓ navigate↵ openTAB cycle filter

Data Interpretation · Question 25 of 75

The chart compares how many units of electricity a household used in each quarter of 2024 and of 2025.

Question 25

EasyOriginal question

The chart compares how many units of electricity a household used in each quarter of 2024 and of 2025. In how many quarters did it use less electricity in 2025 than in 2024?
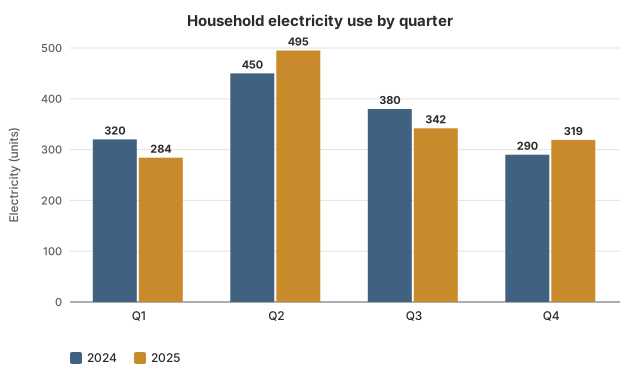
Grouped bar chart titled Household electricity use by quarter, with bars for 2024 and 2025. first quarter: 2024 320 units, 2025 284 units; second quarter: 2024 450 units, 2025 495 units; third quarter: 2024 380 units, 2025 342 units; fourth quarter: 2024 290 units, 2025 319 units.
Options for question 25

Show the answer and explanation
CorrectNot quiteAnswer B

Correct answer: B

Explanation

  1. Q1: 320 to 284 (less). Q2: 450 to 495 (more).

  2. Q3: 380 to 342 (less). Q4: 290 to 319 (more). So 2 quarters.

Worth noting

1 misses the first quarter, where use fell from 320 to 284.

Concept
Comparing paired bars
Typical time
45 s
Your time
—
The rule this testsBar graphs
Practise this chapter →

Ten questions from Data Interpretation, at your own pace.

Practise this chapter →

Ten questions from Data Interpretation, at your own pace.