EduFarming
Your list · 0हिं

Type at least two letters. Press Esc to close.

↑↓ navigate↵ openTAB cycle filter

Data Interpretation · Question 53 of 75

Over the whole week shown in the Patna coaching centre's graph, by what percentage was total evening…

Question 53

MediumOriginal question

Over the whole week shown in the Patna coaching centre's graph, by what percentage was total evening attendance lower than total morning attendance?
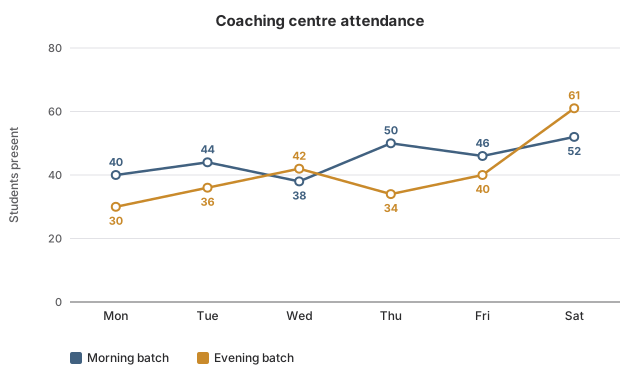
Line graph with two lines titled Coaching centre attendance. Morning batch: Monday 40 students; Tuesday 44 students; Wednesday 38 students; Thursday 50 students; Friday 46 students; Saturday 52 students. Evening batch: Monday 30 students; Tuesday 36 students; Wednesday 42 students; Thursday 34 students; Friday 40 students; Saturday 61 students.
Options for question 53

Show the answer and explanation
CorrectNot quiteAnswer A

Correct answer: A

Explanation

  1. Morning total: 270. Evening total: 30+36+42+34+40+61=24330 + 36 + 42 + 34 + 40 + 61 = 243.

  2. Gap: 270−243=27270 - 243 = 27.

  3. Percentage lower: 27270×100=10%\frac{27}{270} \times 100 = 10\%.

Worth noting

11.1% divides the gap by the evening total; 'lower than morning' makes the morning total the base. 27% mistakes the gap of 27 students for a percentage. 90% is evening as a percentage of morning, not the shortfall.

Concept
'Less than' percentage measured on the compared-to value
Typical time
80 s
Your time
—
The rule this testsLine graphs
Practise this chapter →

Ten questions from Data Interpretation, at your own pace.

Practise this chapter →

Ten questions from Data Interpretation, at your own pace.